52-Week High in Stock Selection: Backtesting Results
Does filtering stocks near their 52-week high improve returns? BossInvestor backtesting data shows win rate rising from 59.34% to 61.41% with the 52W High filter.

What Is the 52-Week High Parameter in Stock Selection?
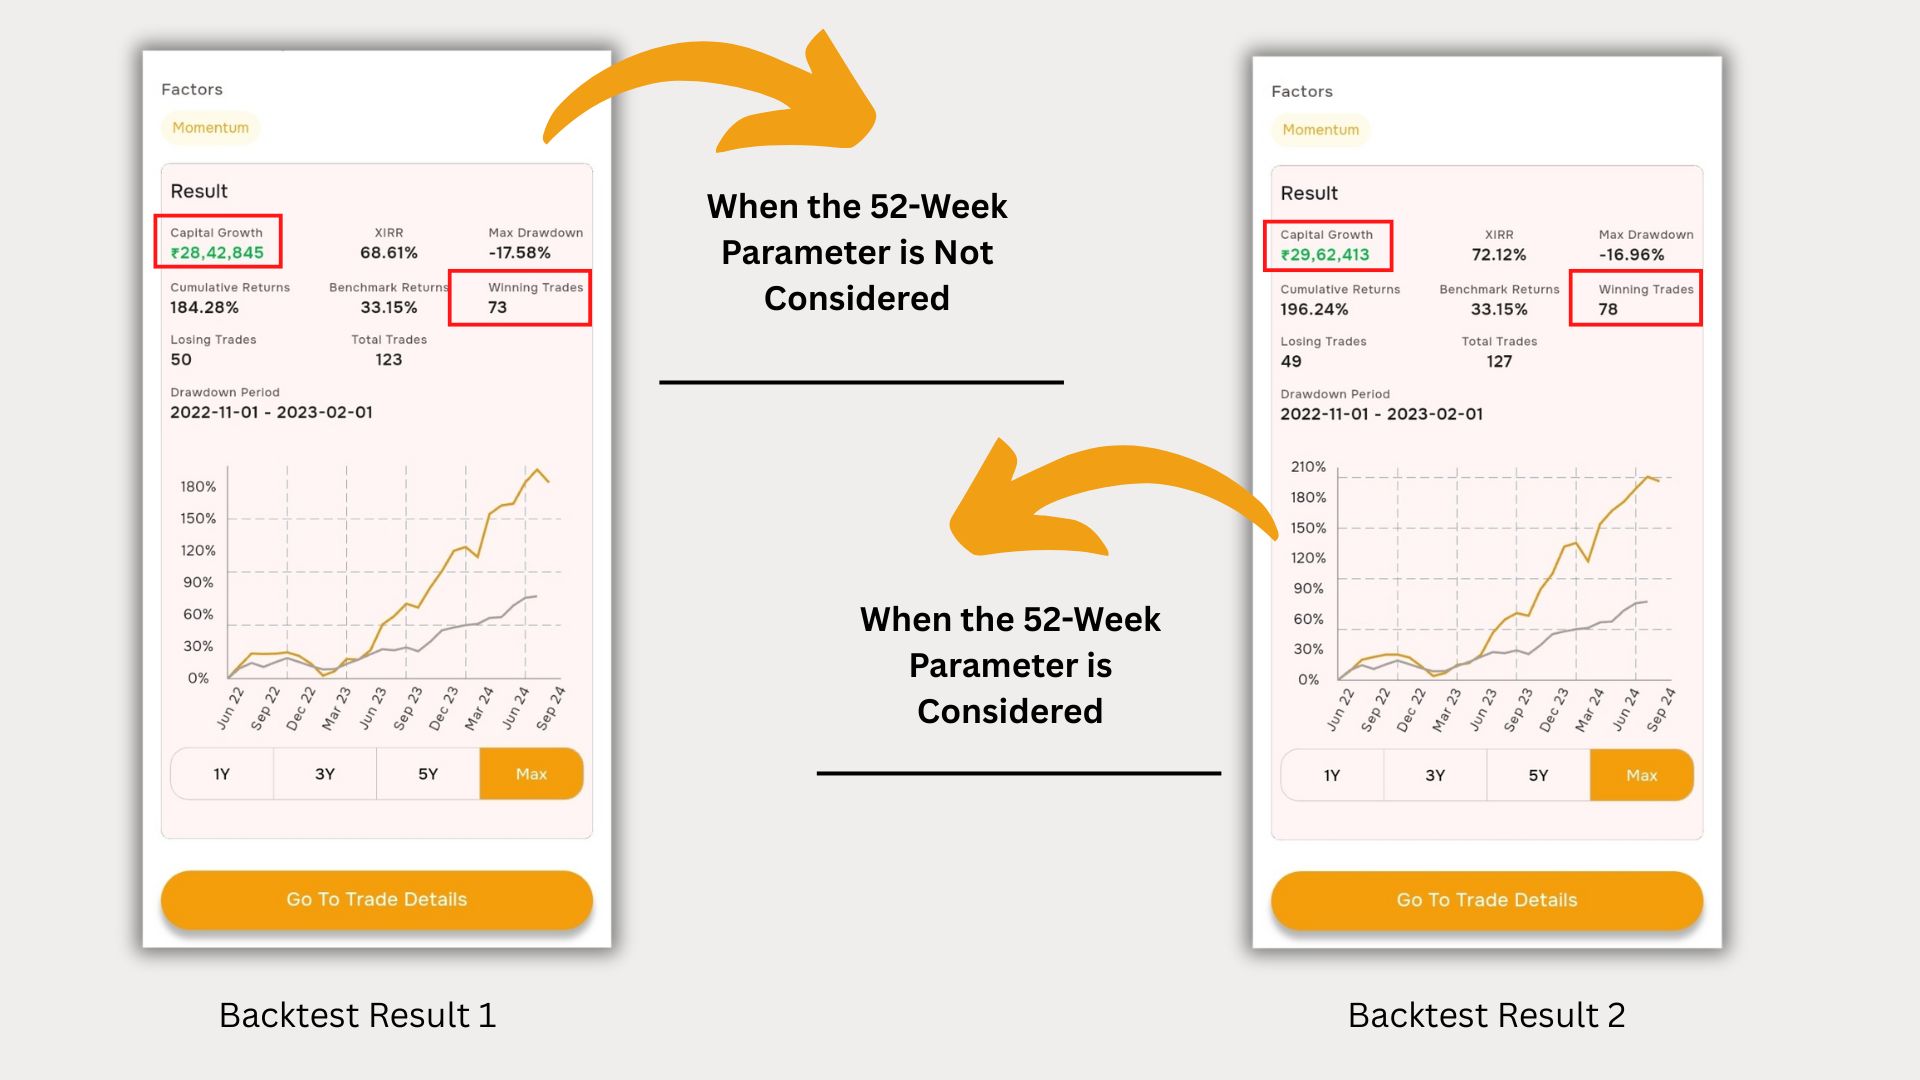
The 52-week high parameter filters stocks based on their proximity to the highest price reached in the past 12 months. In stock selection, using this filter helps investors focus on stocks showing relative strength and momentum. BossInvestor backtesting data shows that applying this filter improves win rate from 59.34% to 61.41% and CAGR from 68.61% to 72.12% on the Nifty 500 universe.
Definition: The 52-week high is the highest closing price a stock has recorded over the preceding 52 weeks (12 months). It is used as a momentum and strength indicator — stocks trading close to their 52-week high are generally considered to be in stronger trends than those trading far below it.
Key Takeaways
- Stocks near their 52-week high demonstrate stronger momentum and are favoured by institutional investors as strength indicators.
- BossInvestor backtesting (Jan 2022 – Jan 2024, Nifty 500, ₹10,00,000 initial capital) shows the 52W High filter improves CAGR from 68.61% to 72.12%.
- Win rate improves from 59.34% to 61.41% and maximum drawdown reduces marginally from 17.58% to 16.96% when the filter is applied.
- The improvement is incremental, not dramatic — the 52W High parameter works best as a supplementary filter alongside indicators like ROC, moving averages, or RSI.
- Three proximity thresholds are available on the BossInvestor platform: 10%, 15%, and 20% away from the 52-week high.
Introduction
When selecting stocks, traders and investors rely on a range of technical indicators to improve their success rates. The 52-week high — the highest price a stock has reached over the past year — is one of the most widely tracked levels in the market. It signals momentum, attracts institutional attention, and acts as a psychological reference point for breakouts.
The BossInvestor backtesting tool allows investors to test different strategies systematically, including filtering stocks based on their proximity to the 52-week high. While this parameter does not produce dramatic shifts in performance on its own, our backtests show a consistent, measurable improvement in success rates when stocks near their 52W High are prioritised over an unfiltered universe.
This article examines what the 52W High Away parameter is, what the backtesting data shows, and when this filter adds the most value to a stock selection strategy.
Understanding the 52-Week High and Its Role in Investing
What Is the 52-Week High?
The 52-week high is the highest price a stock has traded at over the preceding 12 months. It is one of the most commonly referenced data points in technical analysis for three reasons: it signals strong price momentum when a stock is trading near its high; it is used by institutional investors as a measure of relative strength against the broader market; and it functions as a psychological resistance level where breakouts — when prices push decisively above the previous high — can generate significant follow-through momentum.
What Is the 52W High Away Parameter?
In the BossInvestor backtesting tool, the 52W High Away parameter filters stocks based on how far their current price is from their 52-week high. Three threshold options are available:
- 10% Away — Stocks trading within 10% of their 52-week high.
- 15% Away — Stocks trading within 15% of their 52-week high.
- 20% Away — Stocks trading within 20% of their 52-week high.
Applying this filter concentrates the stock selection on names exhibiting relative strength — those that have held up better than the broader market and are closer to re-testing or breaking out to new highs.
Backtesting Results: With vs. Without the 52W High Parameter
To quantify the impact of this filter, two backtests were run using identical parameters. The setup: initial capital of ₹10,00,000, maximum of 15 stocks selected from the Nifty 500 universe, monthly portfolio rebalancing, and a testing period from 1st January 2022 to 1st January 2024. The only variable between the two tests was the presence or absence of the 52-week high proximity filter.
Backtest Result 1: Without the 52W High Parameter
Observations:
- Lower win rate and returns compared to the 52W High filtered strategy.
- Some stocks performed well, but the universe also included stocks in weaker trends.
- Slightly higher maximum drawdown.
Backtest Result 2: Using the 52W High Away Parameter
Observations:
- Slight but consistent improvement in success rate and CAGR.
- More consistent performance with fewer weak or trend-less stocks entering the portfolio.
- Risk profile remained similar, but drawdowns were marginally lower.
Comparison: What the Numbers Show
Applying the 52-week high filter — specifically selecting stocks trading within 10% of their 52-week highs — produced measurably better outcomes across all three key metrics. The win rate improved from 59.34% to 61.41%, CAGR increased from 68.61% to 72.12%, and maximum drawdown reduced from 17.58% to 16.96%. This combination of higher returns and marginally lower drawdown indicates that the filter enhances portfolio quality without introducing additional risk.
The improvement is incremental rather than transformational. Stocks near their 52W High showed slightly better consistency and performance over the test period — a finding that aligns with broader academic research on momentum and relative strength effects in equity markets.
When Does the 52W High Parameter Add Value?
Filtering for Stronger Trend Stocks
Stocks trading near their 52-week highs are, by definition, in stronger price trends than those trading well below recent peaks. Applying the proximity filter naturally removes stocks that are in downtrends or consolidating without directional conviction — reducing the likelihood of entering positions in weak momentum environments.
Improving Return Consistency
The backtesting results indicate that the primary benefit of the 52W High filter is not a dramatic uplift in raw returns but a reduction in the frequency of significant drawdowns. Fewer weak stocks entering the portfolio means fewer large individual-stock losses dragging on overall performance — which compounds positively over time through more consistent monthly results.
Best Used as a Supplementary Filter
The 52W High Away parameter is not designed to be a standalone strategy. It works best as an additional layer within a broader multi-factor screening framework. Combining it with momentum indicators such as Rate of Change (ROC), moving average filters, or RSI thresholds further refines the selection universe and improves the probability of entering stocks with both price momentum and technical confirmation.
Conclusion
The 52-week high is a practical, data-supported parameter for improving stock selection consistency. BossInvestor's backtesting results confirm that filtering for stocks near their 52W High produces a measurable improvement in win rate, CAGR, and drawdown metrics across the Nifty 500 universe — even when every other strategy variable is held constant. Used alongside complementary technical filters, it is a reliable addition to any systematic stock selection process.
BossInvestor is a SEBI Registered Research Analyst (INH000024143). Backtesting results are based on historical data and do not guarantee future performance.
Frequently Asked Questions
What does 52-week high mean in stock market investing?
The 52-week high refers to the highest price at which a stock has traded over the preceding 12 months. It is one of the most widely tracked technical reference points in equity markets. Stocks trading near their 52-week high are generally considered to be in strong upward trends, which is why institutional investors use the level to assess relative strength. It also serves as a psychological resistance point — a decisive move above the 52-week high often signals a breakout and can attract significant buying momentum.
Does filtering stocks near their 52-week high improve backtesting results?
Based on BossInvestor's backtesting data across the Nifty 500 universe (January 2022 to January 2024), yes — applying a 52-week high proximity filter produced consistent improvement across all key metrics. Win rate rose from 59.34% to 61.41%, CAGR improved from 68.61% to 72.12%, and maximum drawdown reduced from 17.58% to 16.96%. The improvement is incremental rather than dramatic, but it is consistent and directionally clear: the filter improves portfolio quality by reducing exposure to stocks in weak or directionless trends.
What is the 52W High Away parameter in the BossInvestor app?
The 52W High Away parameter in BossInvestor's backtesting tool allows users to filter their stock universe based on how close each stock's current price is to its 52-week high. Three options are available: 10% away (stocks trading within 10% of their annual high), 15% away, and 20% away. A tighter threshold — such as 10% — concentrates the portfolio on the strongest-trending stocks in the universe. Users can combine this parameter with other filters such as ROC, RSI, or moving averages to build more refined screening strategies.
Should Indian investors use the 52-week high as a stock selection filter?
The 52-week high filter is relevant for Indian investors, particularly those using momentum-based or systematic strategies on indices like the Nifty 500. Indian mid and small-cap stocks can be highly volatile, and filtering for proximity to 52-week highs helps ensure that selected stocks are in confirmed uptrends rather than speculative recovery phases. However, it should not be used in isolation. Combining the 52-week high filter with fundamental screens — earnings growth, ROE, debt levels — or technical confirmations like RSI and moving averages produces more robust results than any single filter alone.
What indicators work best alongside the 52-week high parameter?
The 52-week high parameter is most effective as part of a multi-factor framework. Indicators that complement it well include Rate of Change (ROC) — which confirms the strength of recent price momentum; moving averages (20-day, 50-day, or 200-day) — which validate the broader trend direction; and RSI — which helps avoid stocks that are technically overbought even while near their 52-week high. Fundamental filters such as earnings growth consistency and low debt can further ensure that the price strength is supported by genuine business performance rather than speculative momentum alone.
Related Blogs

Biocon Shares Jump 6% on Volume Breakout & Biosimilars Growth
Published: Thu Jul 16 2026Read more…

SBI Funds Management IPO Closes: ₹11,693 Cr Issue Sets Record
Published: Thu Jul 16 2026Read more…

Alok Industries Q1 FY27 Results Board Meeting Today
Published: Thu Jul 16 2026Read more…
ITC Hotels Slips 5% Despite 36% Jump in Q1 Net Profit
Published: Fri Jul 17 2026Read more…