When selecting stocks, many traders and investors use technical indicators to improve their success rates. One such indicator is the 52-week high (52W High)—the highest price a stock has reached in the past year.
DocumentIntroduction
When selecting stocks, many traders and investors use technical indicators to improve their success rates. One such indicator is the 52-week high (52W High)—the highest price a stock has reached in the past year.
In the Boss Investor app, we provide a backtesting tool that helps investors test different strategies, including filtering stocks based on their proximity to the 52W High.
While this parameter doesn’t drastically change results, our backtests show a slight improvement in success rates when considering stocks near their 52W High compared to selecting stocks without this filter.
In this blog, we will analyze the impact of using the 52W High Away parameter and how it can be a useful factor in stock selection.
Understanding the 52-Week High and Its Role in Investing
What is the 52-Week High?
The 52-week high is the highest price a stock has reached in the last 12 months. Many traders track this level because:
- It can signal strong momentum when a stock is near its high.
- It is often used by institutional investors to assess strength.
- It serves as a psychological level where breakouts can occur.
What is the 52W High Away Parameter?
In our Boss Investor backtesting tool, we allow users to filter stocks based on how far they are from their 52W High:
- 10% Away – Stocks trading within 10% of their 52W High.
- 15% Away – Stocks within 15% of their 52W High.
- 20% Away - Stocks within 20% of their 52W High.
This helps focus on stocks that are relatively stronger than others.
Backtesting Results: With vs. Without the 52W High Parameter
To test the impact of this filter, we conducted two backtests using identical parameters. We started with an initial capital of ₹10,00,000, selecting a maximum of 15 stocks from the NIFTY 500 universe. The portfolio was rebalanced monthly, and the testing period spanned from 1st January 2022 to 1st January 2024. This ensured a fair comparison between the performance of strategies with and without the 52-week high filter.
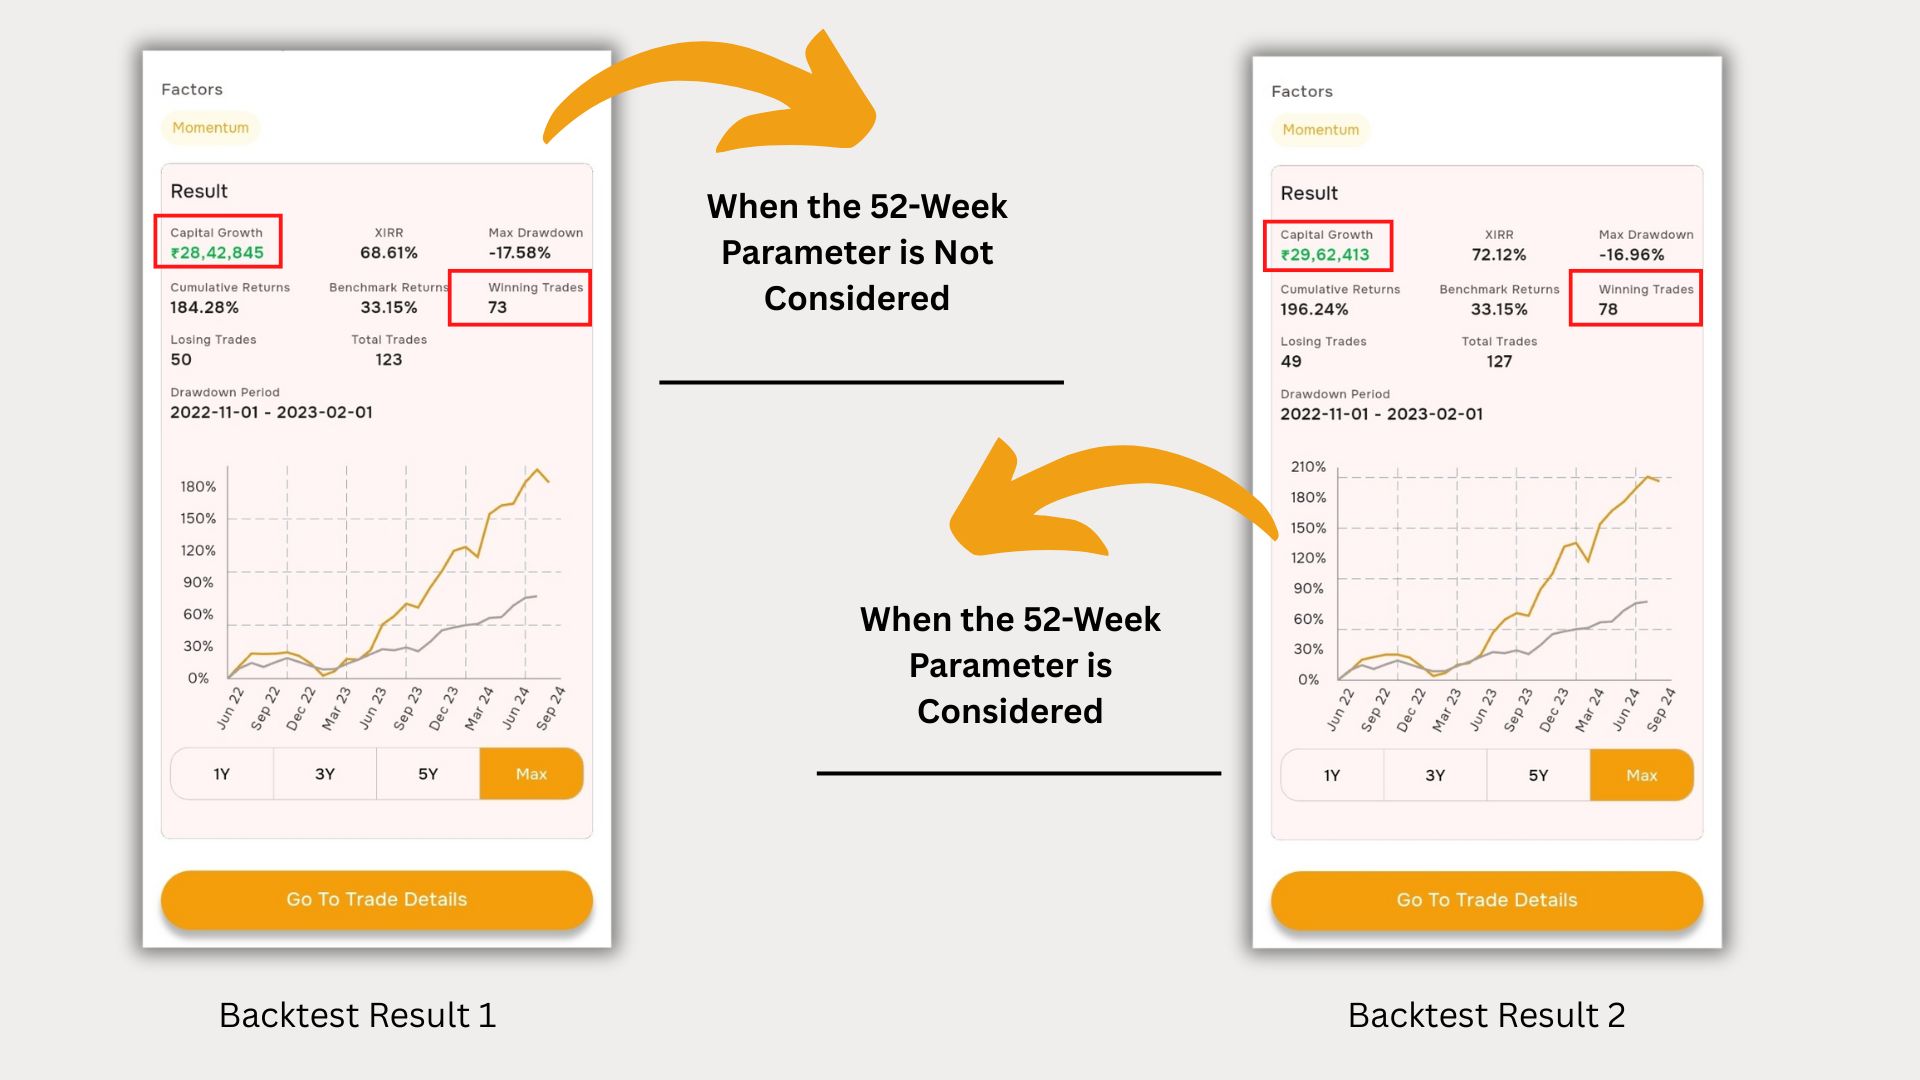
Backtest Result 1: Without the 52W High Parameter
Observations:
- A lower win rate and returns compare to 52w high parameter
- Some stocks performed well, but also included stocks in weaker trends
- Slightly higher drawdown
Backtest Result 2: Using the 52W High Away Parameter
Observations:
- Slight improvement in success rate and CAGR
- More consistent performance with fewer weak stocks
- Risk remained similar, but drawdowns were slightly lower
Comparison
Applying a 52-week high filter—specifically selecting stocks trading at least 10% below their 52-week highs—led to better overall performance. The win rate improved from 59.34% to 61.41%, CAGR increased from 68.61% to 72.12%, and maximum drawdown slightly reduced from 17.58% to 16.96%, indicating enhanced returns with marginally lower risk.
Key Takeaway: While the difference is not drastic, stocks near their 52W High showed slightly better consistency and performance over time.
When Does the 52W High Parameter Help?
Filtering Strong Stocks
Stocks near their 52W Highs tend to be in better trends, helping traders avoid weaker stocks.
More Stable Returns
Backtesting results suggest that while overall returns are similar, stocks near their 52W High tend to have fewer drastic drawdowns.
Not a Standalone Factor
The 52W High parameter works best when combined with other filters, such as roc, moving average, or RSI etc.
Conclusion
The 52-week high is a useful parameter that can help traders focus on stronger stocks. While our backtesting results show improvement in winning rate when using this filter, it helps create more consistent performance and slightly improves success rates.