

Growth is a key driver of asset appreciation, whether in equities, real estate, or private equity. Investors pursue growth because it signals expansion, value creation, and higher future earnings. In the stock market, companies with strong financial growth attract premium valuations and sustained investor interest. Among all asset classes, equities provide the most accessible and liquid way to participate in growth, offering lower capital requirements and greater flexibility compared to real estate or private equity.
Revenue Growth: The Foundation of Financial Performance
Eye Catches Revenue First
Revenue, often called "top-line growth," is the most fundamental indicator of a company’s financial health. It reflects the total income generated from core business activities before any costs or expenses are deducted. Since every financial metric—operating income, net profit, and EPS—is derived from revenue, it serves as the foundation of a company’s financial performance.
Historical Revenue Trends & Stock Performance
Revenue trends play a critical role in shaping investor sentiment. Consistent revenue growth builds trust, while volatility or decline creates uncertainty. Investors value stability and predictability, making revenue growth an early signal of a company’s ability to expand, capture market share, and generate long-term profits.
When a company steadily increases revenue, it indicates a strong business model, growing demand, and efficient scaling. This revenue acceleration reassures investors of future earnings growth, often leading to premium valuations.
Case Study 1: Asian Paints – Decades of Consistent Revenue Growth
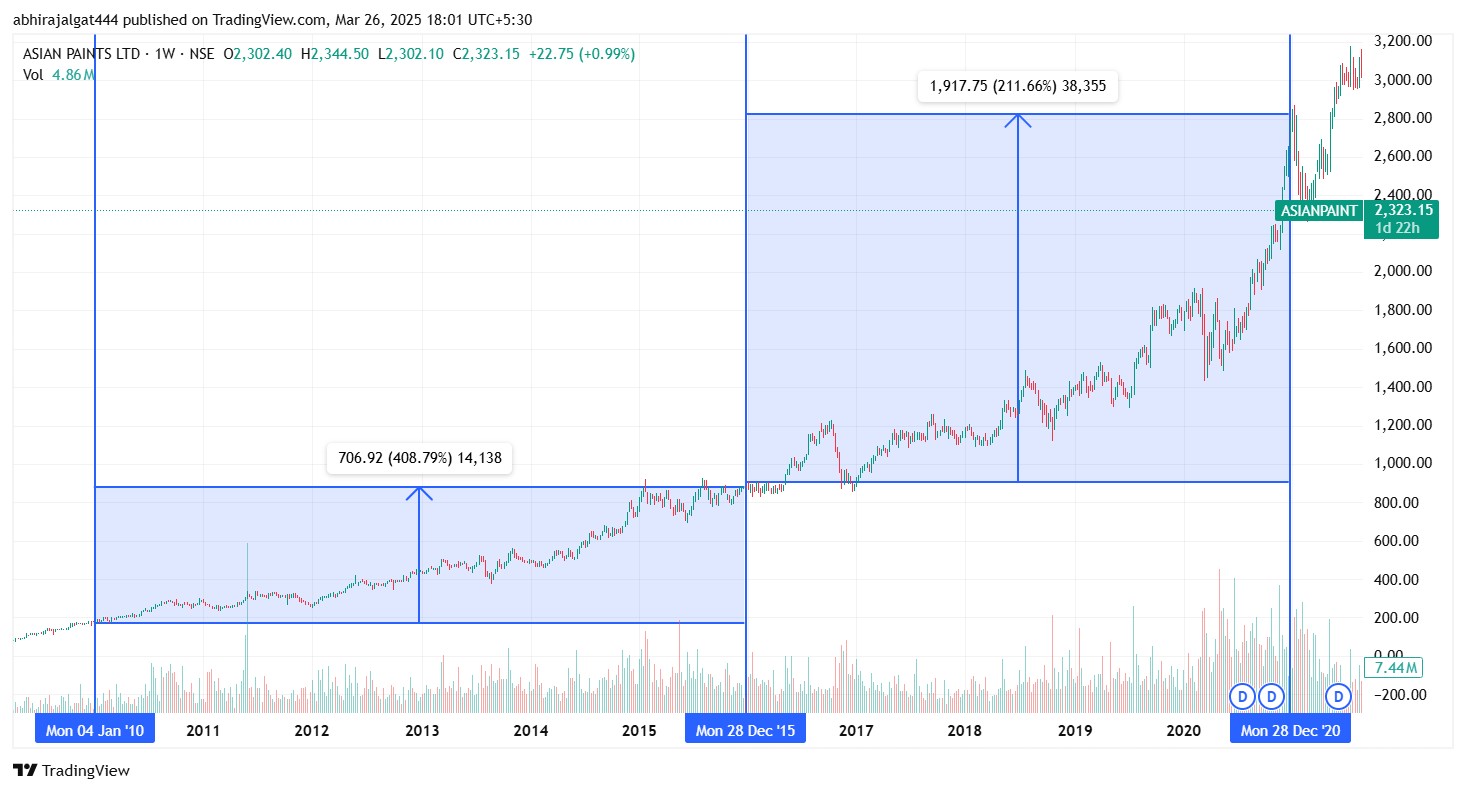
Revenue Growth Timeline:
- 2010-2015: Asian Paints maintained a CAGR of ~14-16% in revenue, benefiting from the real estate boom and increased urbanization.
- 2016-2020: The company navigated through economic slowdowns while still achieving 10-12% revenue growth annually, proving its resilience.
Case Study 2 : Bajaj Finance – Financial Services Growth Story
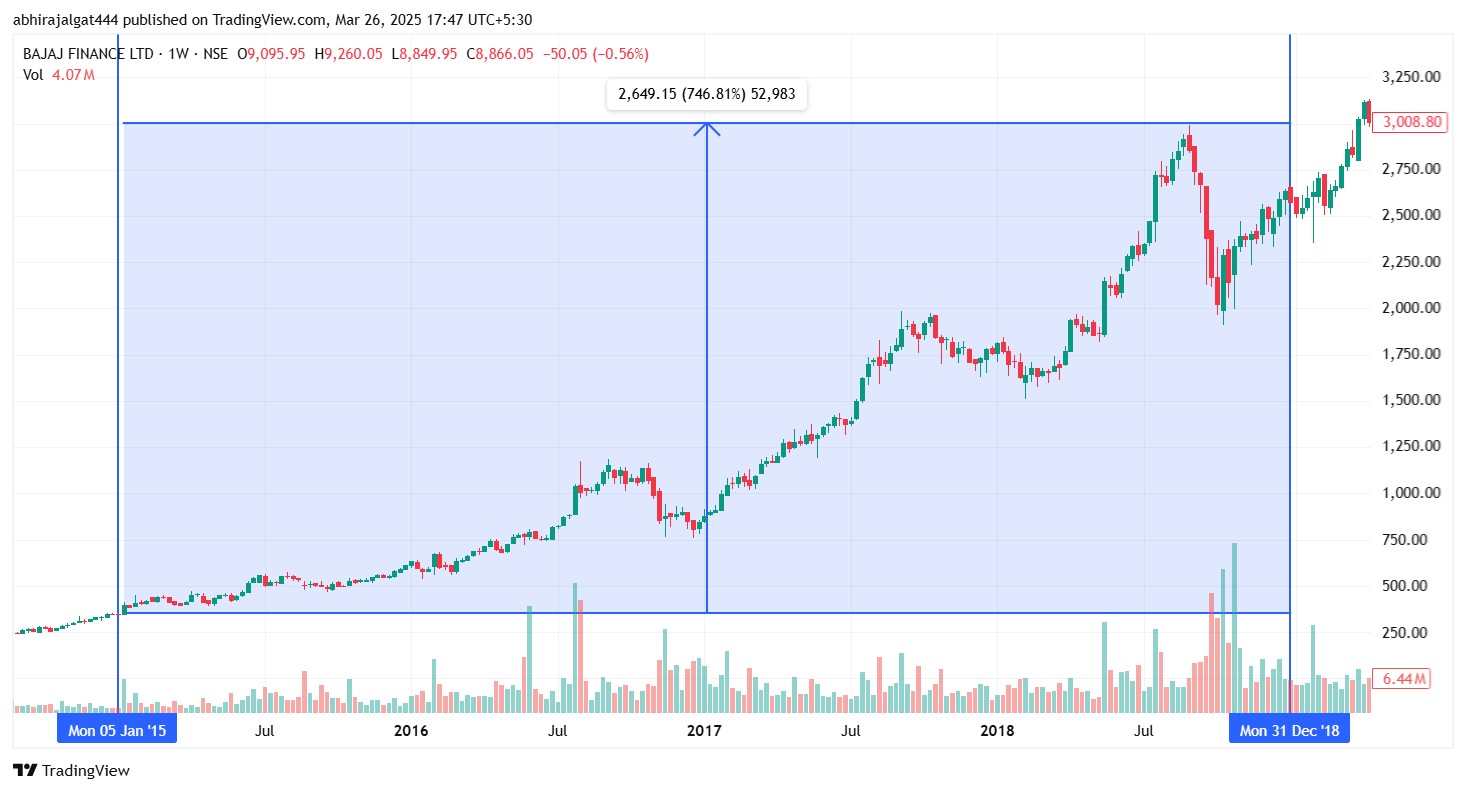
Revenue Growth Timeline:
- 2015-2018: Bajaj Finance's revenue grew at a CAGR of ~35%, driven by the expansion of its consumer lending business and digital transformation.
- 2019-2021: Despite pandemic-related disruptions, revenue continued to grow, averaging 20% YoY, showcasing resilience in the NBFC sector.
Stock Price Reaction:
- 2015-2018: Stock price surged 5x as investors rewarded rapid expansion in financial services.
- 2019-2021: Even amid COVID-19 uncertainties, the stock maintained an uptrend, reflecting confidence in sustained revenue growth.
Investors viewed consistent revenue growth as a reflection of brand strength and pricing power.
Operating Income: The Profitability Factor
While revenue growth lays the foundation, operating income reveals how efficiently a company converts revenue into profits. It measures earnings before interest and taxes (EBIT) after deducting operating expenses, highlighting cost efficiency and pricing power. Rising operating income signals sustainable profit growth, supporting higher stock valuations, while strong margins indicate a competitive edge, helping companies weather economic downturns.
How Investors Perceive Operating Income Growth
Operating income growth is a key indicator of a company’s ability to generate sustainable profits. While revenue growth signals market expansion, rising operating income reflects cost efficiency, pricing power, and operational effectiveness. Companies with consistent operating income growth are seen as well-managed and resilient.
Institutional investors favor strong operating income growth for its profit scalability—higher earnings without proportionally rising costs. Retail investors, however, often focus on revenue, overlooking that without stable or growing operating income, revenue growth alone doesn’t drive shareholder value.
Market reactions can be sharp. Beating operating income estimates often triggers stock surges, while declining profitability—even with rising revenue—raises concerns over costs and margins, leading to sell-offs. This makes operating income a critical factor in a stock’s long-term appeal.
Revenue Growth vs. Operating Margin: Different Perspectives
Retailers and investors view margins differently. Retailers prioritize revenue growth, relying on high sales volumes—even with thin margins—to sustain profits. This is why many focus on discounts to drive sales, often at the expense of profitability.
Investors, especially institutions, focus on operating margin (OPM) as a measure of efficiency. Strong revenue growth with shrinking margins signals poor cost control, while expanding margins indicate a well-managed, scalable business.
This difference creates contrasting market reactions. Record sales may excite retailers but disappoint investors if margins shrink. Conversely, moderate revenue growth with rising OPM often drives stock gains, signaling strong profitability.
Company with High OPM Growth & Market Reaction
Investors closely track Operating Profit Margins (OPM) as a key indicator of financial strength. When companies manage to expand their OPM, it signals better cost control, pricing power, and overall efficiency. The stock market often rewards such companies with higher valuations and stronger price performance, as improving margins indicate sustainable profit growth.
Case Study : Hindustan Unilever (HUL) – Efficiency in a Competitive Market
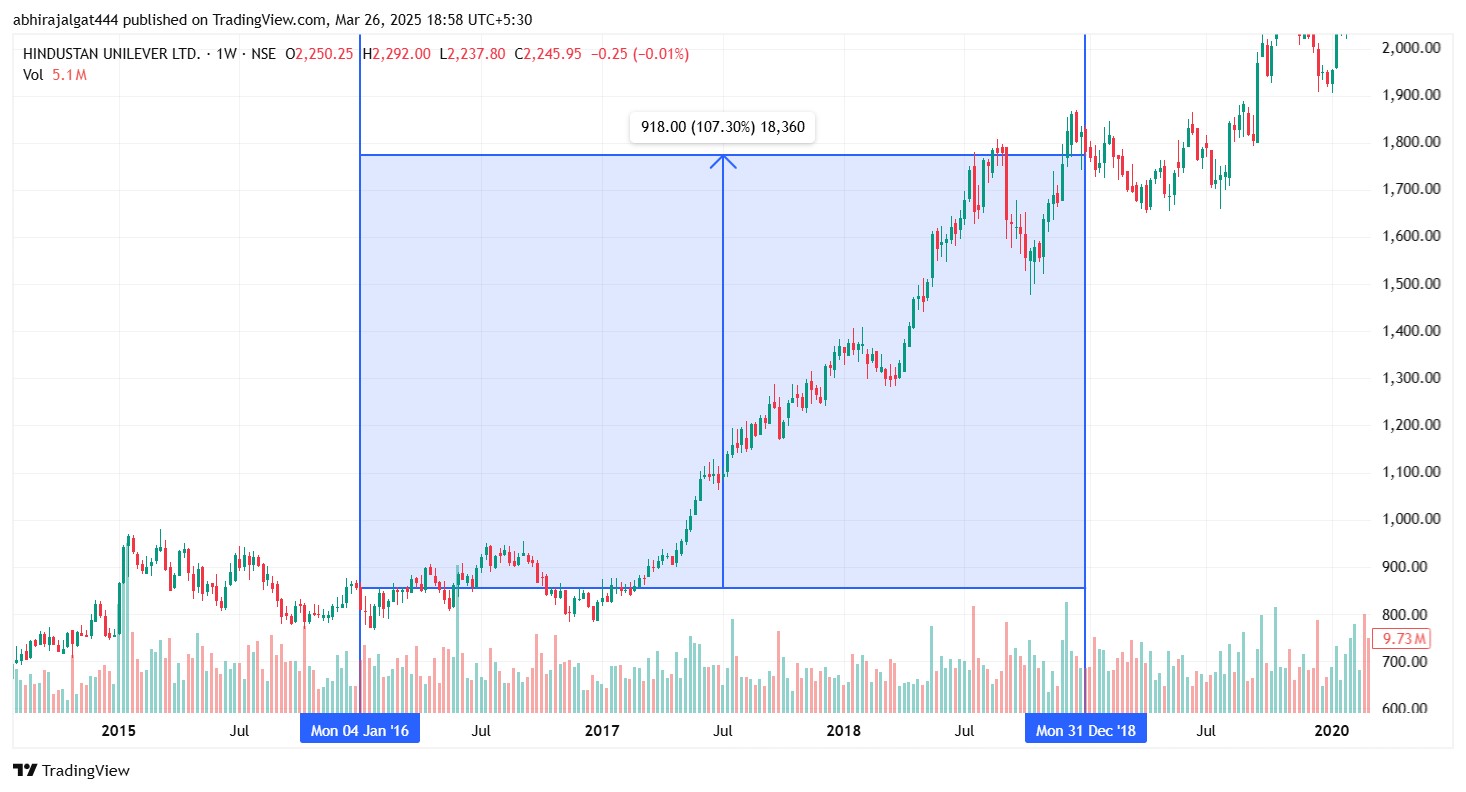
2016-2018: Operating margins expanded from 16% to 19%, driven by premiumization, cost-cutting, and supply chain efficiency, leading to a 2x surge in HUL’s stock price as investors recognized its margin expansion despite inflationary pressures.
Margin expansion drives stock price appreciation, often more than revenue growth alone. Companies that can improve operating efficiency without sacrificing growth tend to outperform. Investors should track businesses with a clear strategy for sustaining high OPM, as they attract premium valuations.
EPS Growth: Creating Shareholder Value
EPS: The Ultimate Wealth Creator
Earnings Per Share (EPS) directly measures a company’s profitability per share, making it crucial for long-term wealth creation. Unlike revenue or operating income, EPS directly impacts stock prices, dividends, and buybacks.
Rising EPS signals strong earnings growth, attracting higher valuations. Institutional and long-term investors prioritize EPS trends over short-term revenue shifts. Since EPS influences key metrics like the Price-to-Earnings (P/E) ratio, consistent growth leads to premium valuations, reinforcing its role in shareholder value creation.
EPS as a Support Level in Uncertain Markets
During market downturns, investors seek companies with stable earnings, as:
- Profitability reassures the market – Strong EPS signals business stability.
- Institutional investors favor steady EPS – Funds allocate capital to earnings-driven stocks.
- EPS-based valuations prevent sharp declines – Reliable earnings create a price floor.
For instance, consumer staples and healthcare stocks with resilient EPS growth often outperform cyclicals during downturns, proving EPS is a psychological anchor in turbulent markets.
EPS drives investor confidence, stabilizing stock performance even in volatile markets.
Revenue Growth + Strong EPS: A Powerful Combo
While revenue growth signals business expansion, it is meaningless without profitability. Investors value companies that not only grow their top line but also translate that growth into higher earnings per share (EPS). When both revenue and EPS improve together, it creates a powerful combination that often leads to substantial stock price appreciation.
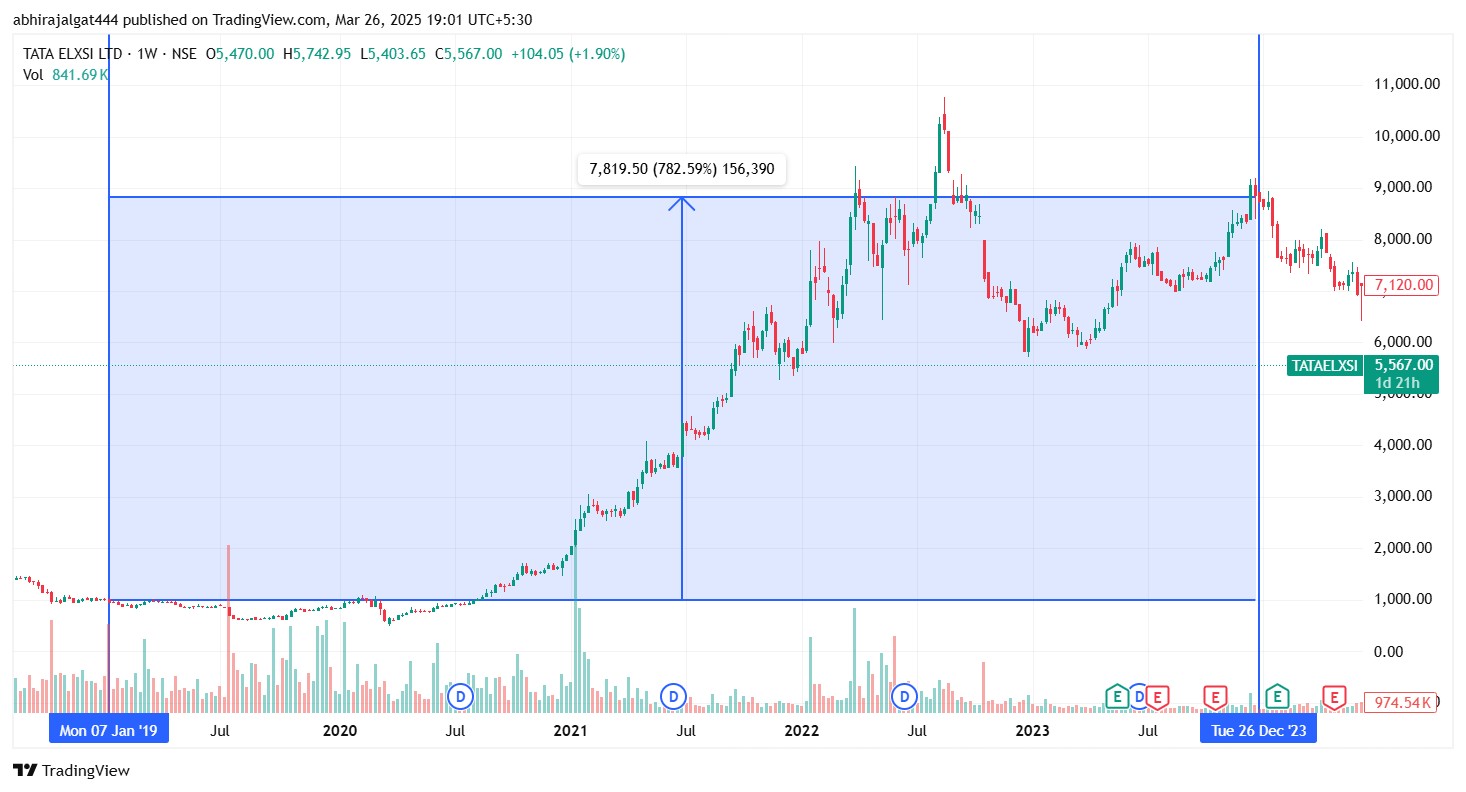
Tata Elxsi – Digital Transformation Success
- Revenue Trend: Between FY2019 and FY2023, Tata Elxsi’s revenue expanded at a CAGR of ~25%, fueled by the demand for AI and cloud-based solutions.
- EPS Growth: EPS surged even faster, more than tripling, as operating margins improved due to high-value digital projects.
- Stock Market Reaction: The stock price multiplied ~6x from 2019 to 2023, as investors recognized the combination of strong revenue and EPS growth.
This synergy between revenue expansion and EPS improvement makes companies attractive for both growth and value investors, ensuring sustainable wealth creation.
Final Thoughts: Why Growth is Key for Investors
Growth is the foundation of long-term wealth creation. Revenue Growth signals business expansion and builds investor confidence, Operating Income Growth reflects efficiency and profitability, and EPS Growth enhances shareholder value, driving stock prices higher. Combining growth with momentum allows investors to capture high-performing stocks. Backtesting growth strategies ensures refined investment decisions for a robust portfolio.
Growth isn’t just a factor—it’s the driving force behind market leadership and wealth creation.
Linking Growth to Momentum: The BossInvestor Edge
Momentum investing thrives on sustained price trends, and at BossInvestor, we enhance this approach by integrating key growth factors—Revenue, Operating Income, and EPS growth. Our momentum strategy is reinforced by a strong focus on financial growth, identifying high-potential stocks through Revenue Growth, which signals increasing market demand; Operating Income Growth, which reflects efficiency and profitability; and EPS Growth, which drives valuation re-ratings and sustained investor interest. To help investors refine their strategies, BossInvestor offers a powerful backtesting tool that enables users to test growth-based parameters, ensuring they identify stocks with sustainable upside potential. By combining growth insights with momentum, we empower investors to make confident, data-driven decisions.