Momentum Strategy Building Guide
Momentum strategy building on BossInvestor. Configure entry rules, moving averages, risk constraints, and exit metrics for equity backtesting.

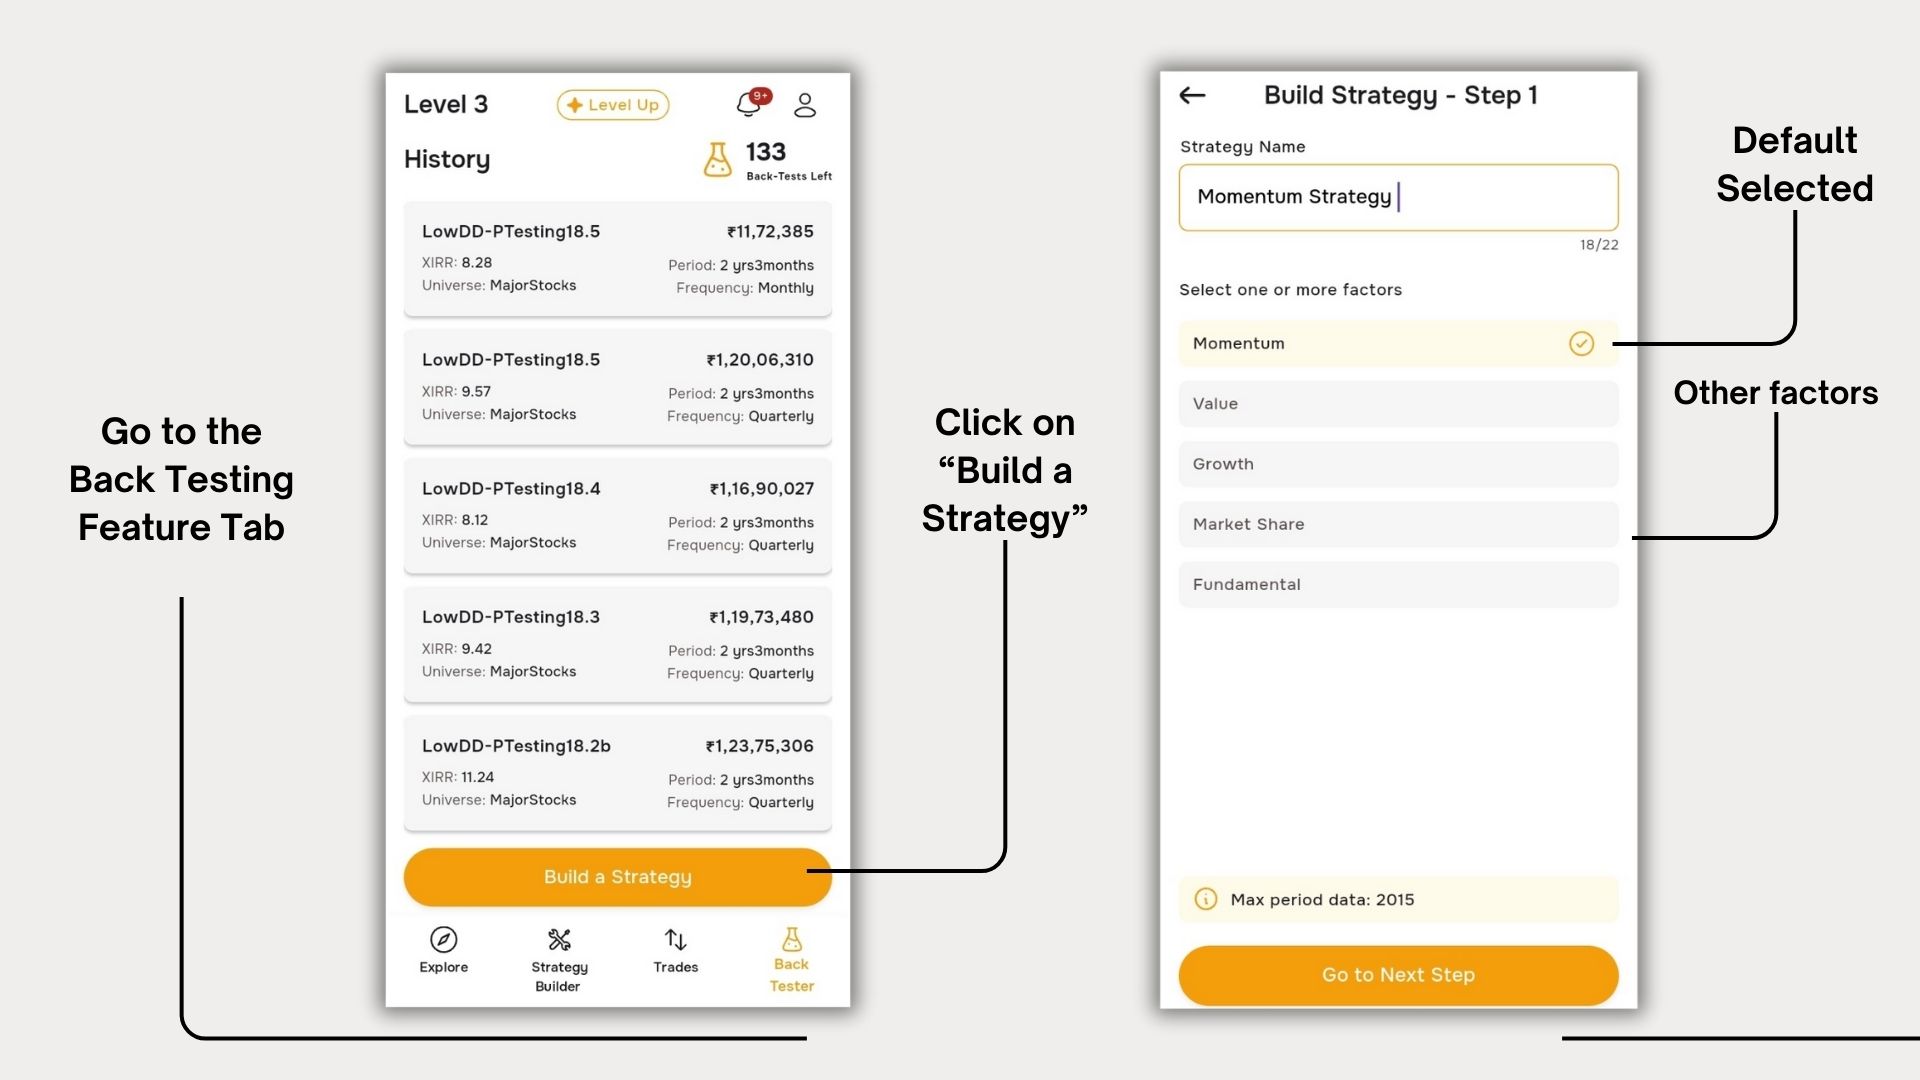
How do you navigate the momentum strategy on BossInvestor?
Navigating the momentum strategy involves choosing your configuration rules within the step-by-step user-friendly framework[cite: 40]. Investors name their framework, define their specific entry, hold, and exit criteria using filters like Rate of Change and moving averages, and then configure capital settings[cite: 40]. The system allows users to execute automated backtests to view critical metrics like CAGR, capital growth, and maximum drawdown based on historical parameters[cite: 40].
Definition: A momentum strategy is an investment method centered on purchasing securities that demonstrate upward price trends and selling them when their upward strength begins to fade[cite: 40]. It relies on quantitative market velocity and price persistence rather than fundamental intrinsic value alone to capture systematic gains[cite: 40]. This rule-based trading approach utilizes technical indicators to systematically manage market exposure and risk[cite: 40].
Key Takeaways
- The default setting immediately pre-selects momentum as the primary choice as soon as an investor clicks on the strategy builder button[cite: 40].
- The system uses a momentum identifier variable such as a five-month rate of change to select stocks that have achieved positive gains[cite: 40].
- Investors can utilize technical indicators like simple, exponential, or weighted moving averages to verify that their chosen stocks are trending[cite: 40].
- Risk management settings allow users to filter out overbought stocks using relative strength index limits and eliminate extreme price fluctuations[cite: 40].
- Positions are systematically liquidated when a stock triggers predefined parameters such as a maximum stop loss or an average directional index reversal signal[cite: 40].
Momentum investing is all about identifying stocks that are gaining strength and riding their trend[cite: 40]. With BossInvestor, you can seamlessly build and execute a momentum strategy using our user-friendly framework[cite: 40]. Here's a step-by-step guide to navigating the Momentum Strategy on our platform[cite: 40].
Step 1: Building Your Strategy
As soon as you click on the “Build a Strategy” button, Momentum is pre-selected as the default strategy[cite: 40]. You just need to:[cite: 40]
- Name your strategy in the Name Box[cite: 40]
- Click “Go to Next Step”[cite: 40]
Step 2: Defining Entry, Hold & Exit Rules
This is the most crucial step, where you configure how stocks enter, stay, and exit your portfolio[cite: 40]. Each sub-section plays a unique role in shaping your momentum strategy[cite: 40].
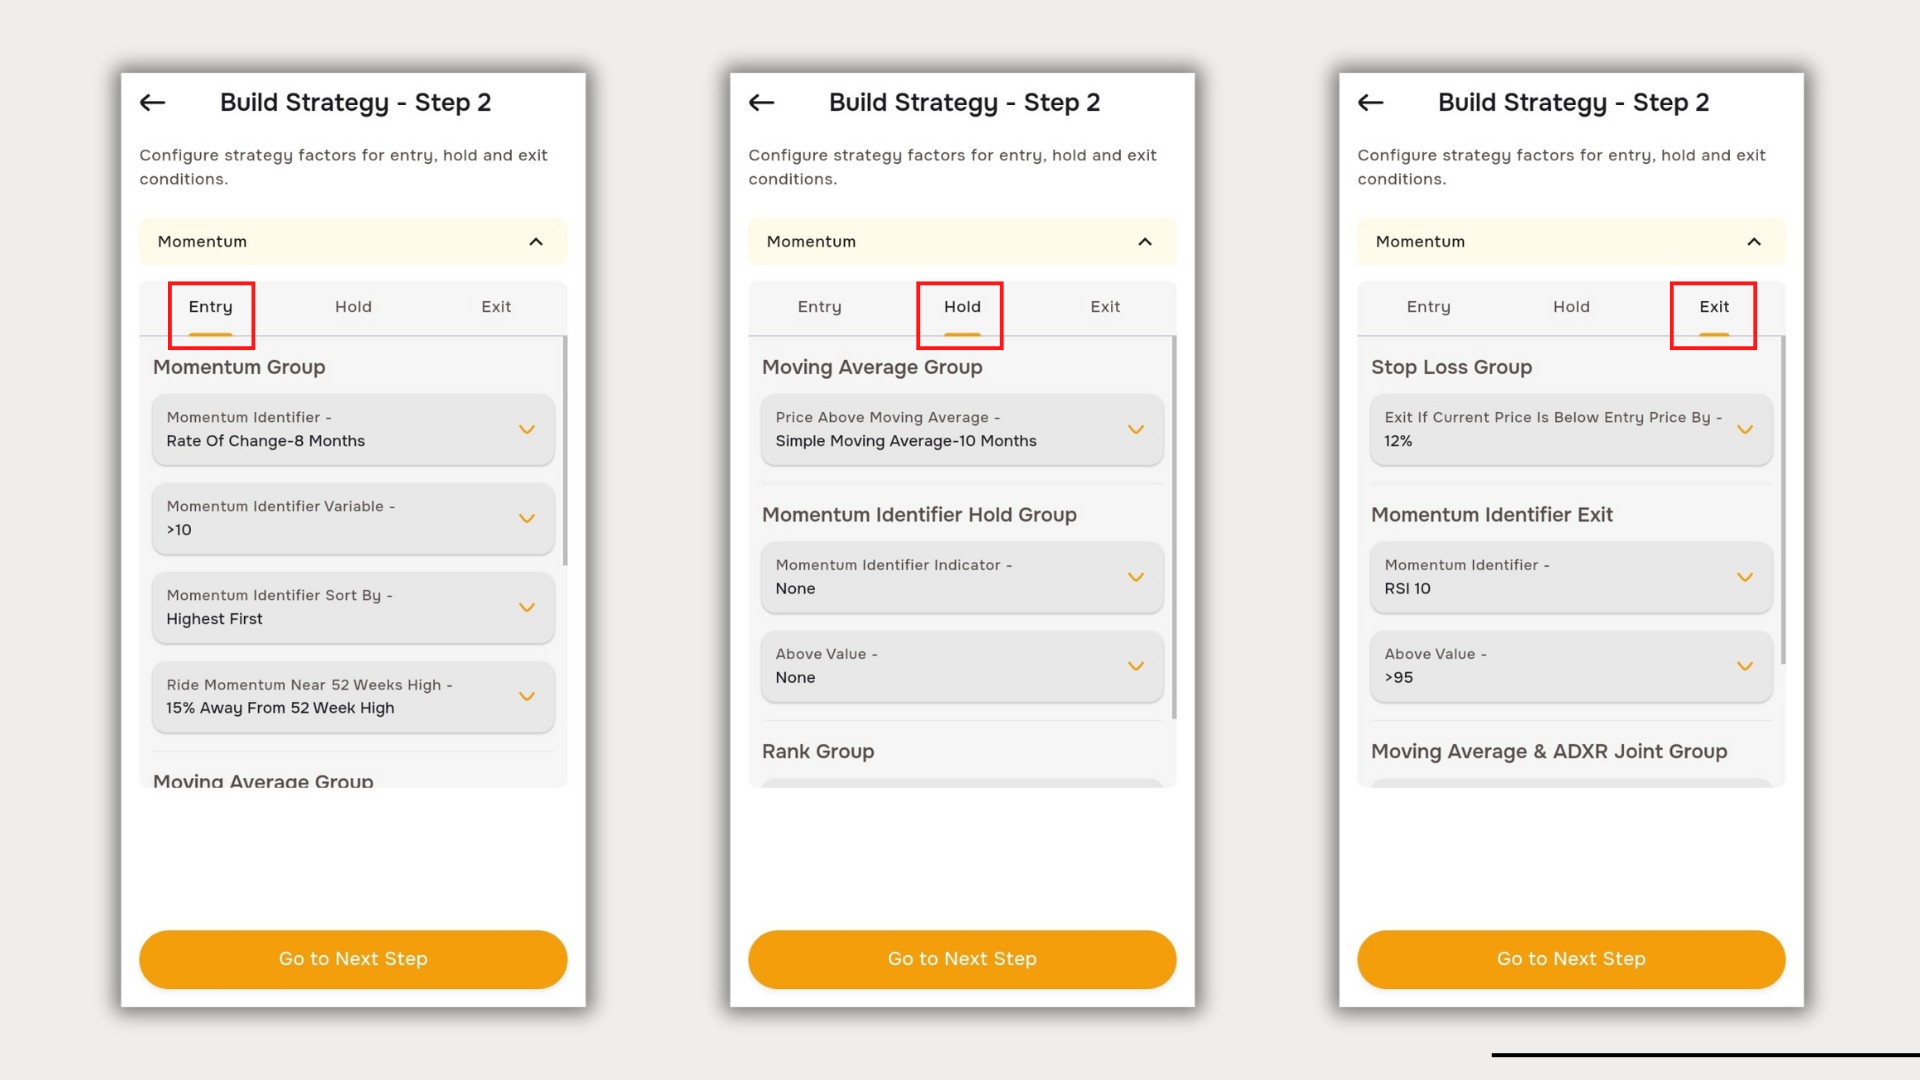
Entry Criteria – Selecting the Right Stocks
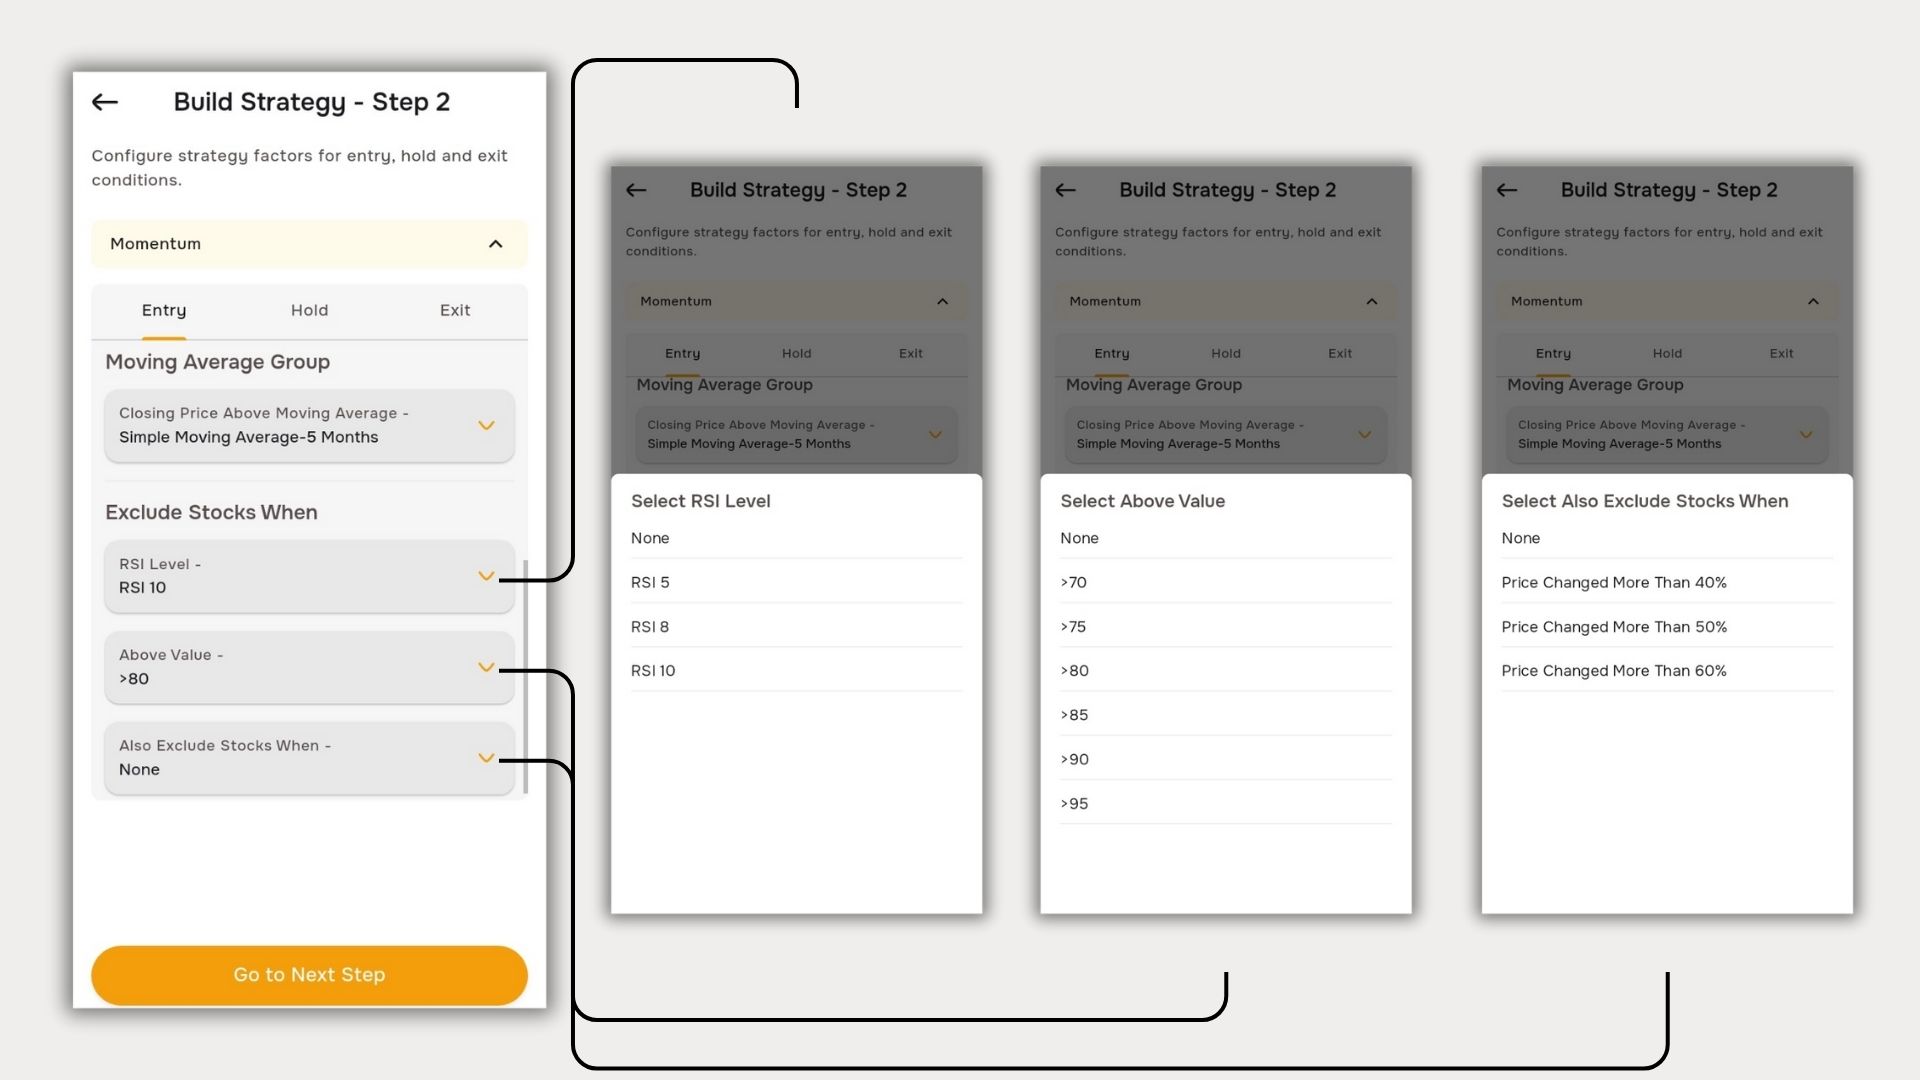
In the Entry Section, you define how stocks qualify for your strategy[cite: 40].
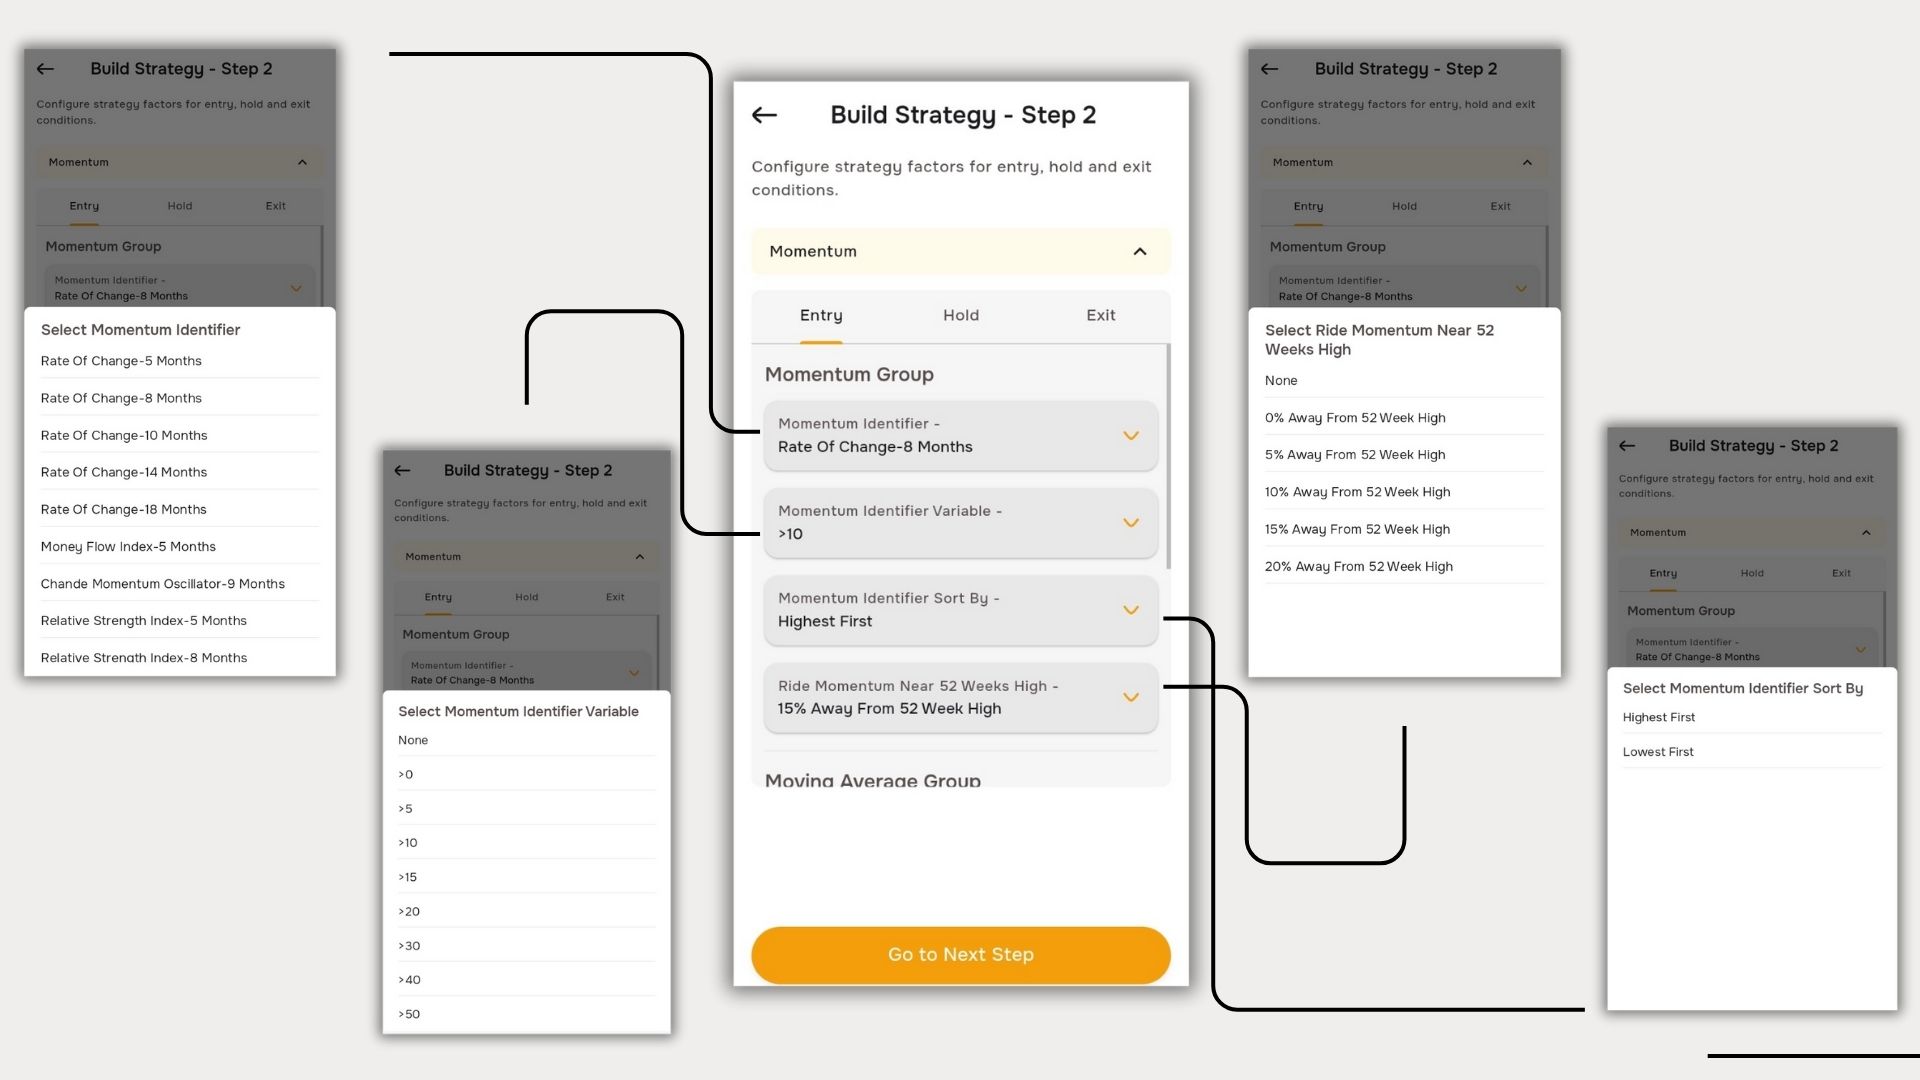
Momentum Group
The Momentum Group consists of four parts:[cite: 40]
- Momentum Identifier: Filters stocks based on their trend strength[cite: 40].
- Momentum Identifier Variable: Defines conditions (e.g., "Rate of Change – 5 Months > 0%")[cite: 40].
Example: If you select Rate of Change – 5 Months and set the variable ">0%", the system picks stocks that have been gaining at least 0% in the last 5 months[cite: 40].
- Sorting Mechanism: Stocks are sorted by highest or lowest change[cite: 40].
- Position Selection: It will pick stocks which are away from 52 week High (as per user need)[cite: 40].
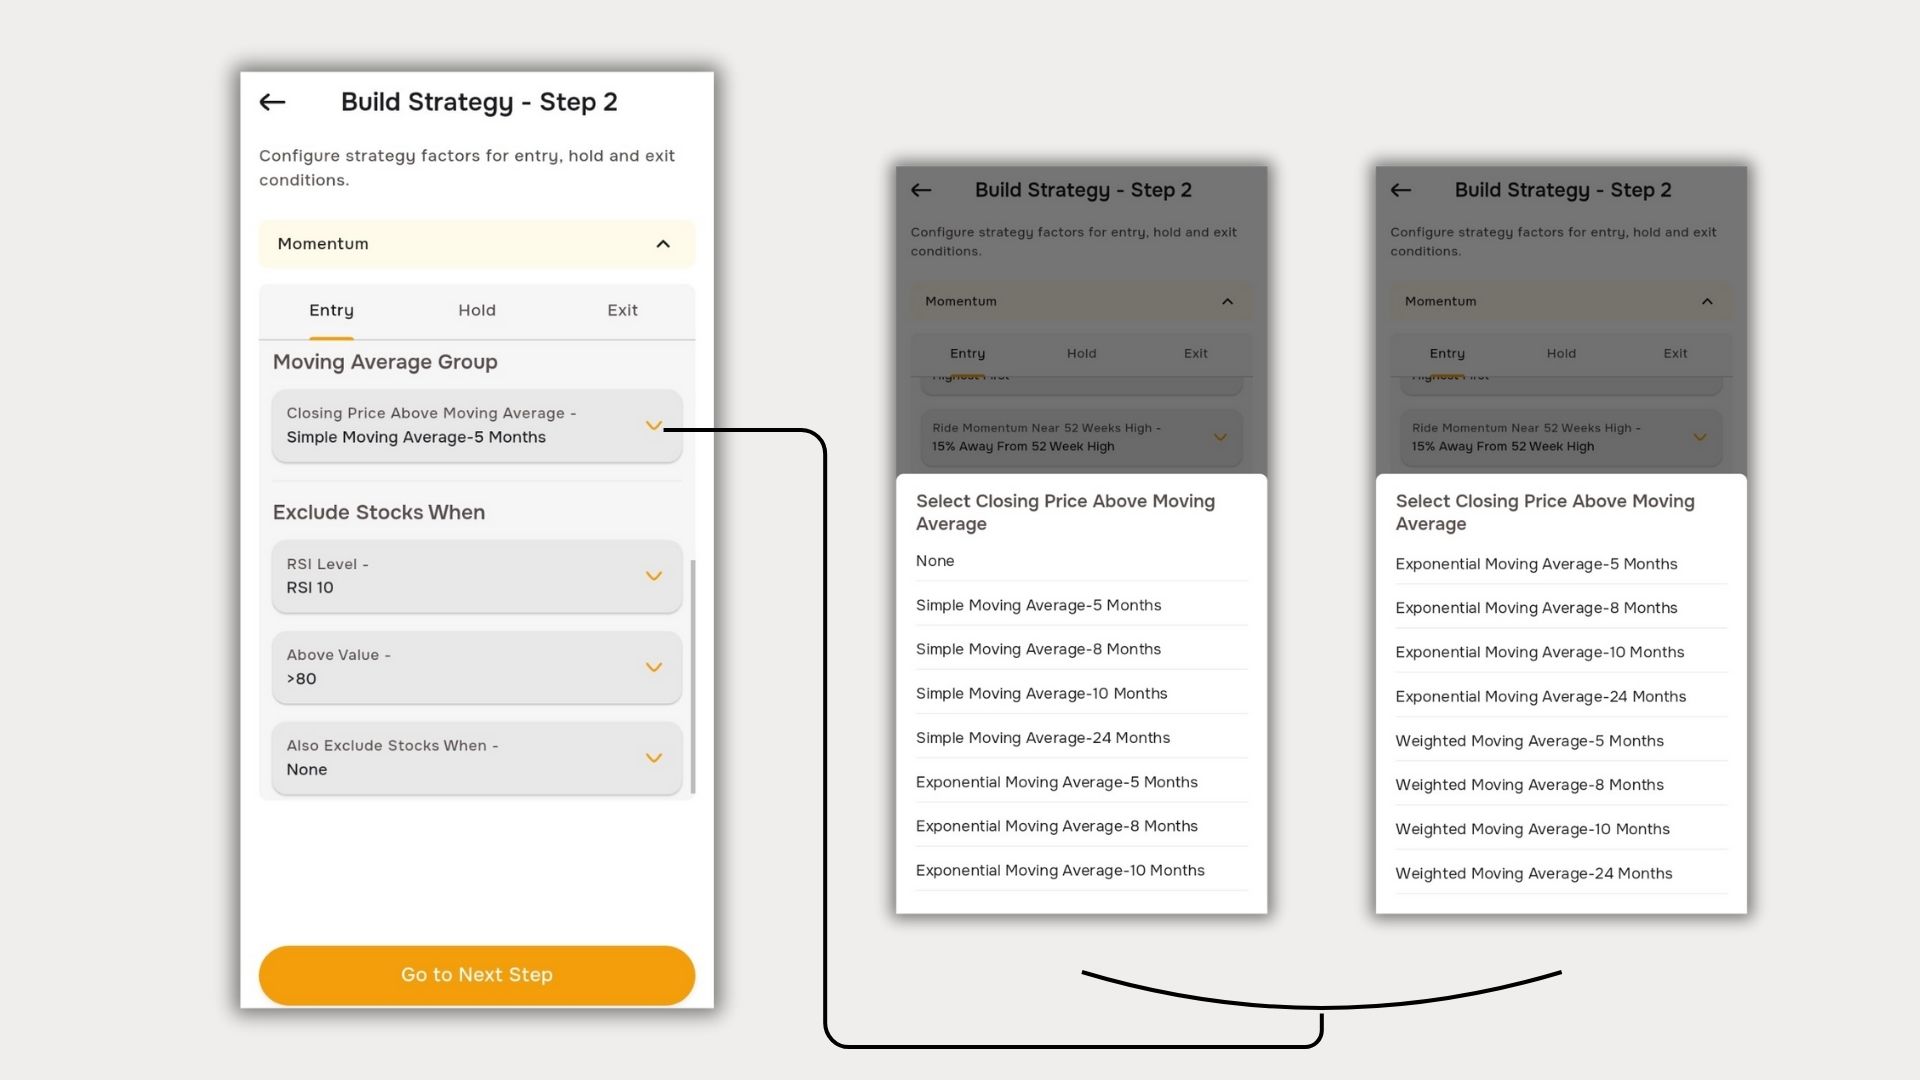
Moving Averages
To ensure your selected stocks are trending, you can apply:[cite: 40]
- Simple Moving Average (SMA)[cite: 40]
- Exponential Moving Average (EMA)[cite: 40]
- Weighted Moving Average (WMA)[cite: 40]
Moving Averages will ensure that the selected stocks have a closing price above your chosen Moving Average[cite: 40].
Different timeframes are available for flexibility[cite: 40].
Avoiding Overbought Stocks
BossInvestor also allows you to filter out stocks that may be overbought[cite: 40].
Example: If you set RSI 10 > 80, stocks with RSI above 80 (which indicates potential overbought conditions) will be excluded[cite: 40].
Here, RSI 10 means the Relative Strength Index of the last 10 months[cite: 40].
Note: This is just an assumption—stocks above RSI 80 can still move up before correcting[cite: 40].
The final part of the strategy excludes stocks that exhibit extreme price fluctuations[cite: 40]. This helps eliminate event-driven momentum stocks, commonly referred to as the 'Frog in the Pan' effect[cite: 40].
Holding Stocks – Managing Positions
Once a stock enters your portfolio, it moves to the Hold & Exit Phase[cite: 40].
The Hold Section consists of:[cite: 40]
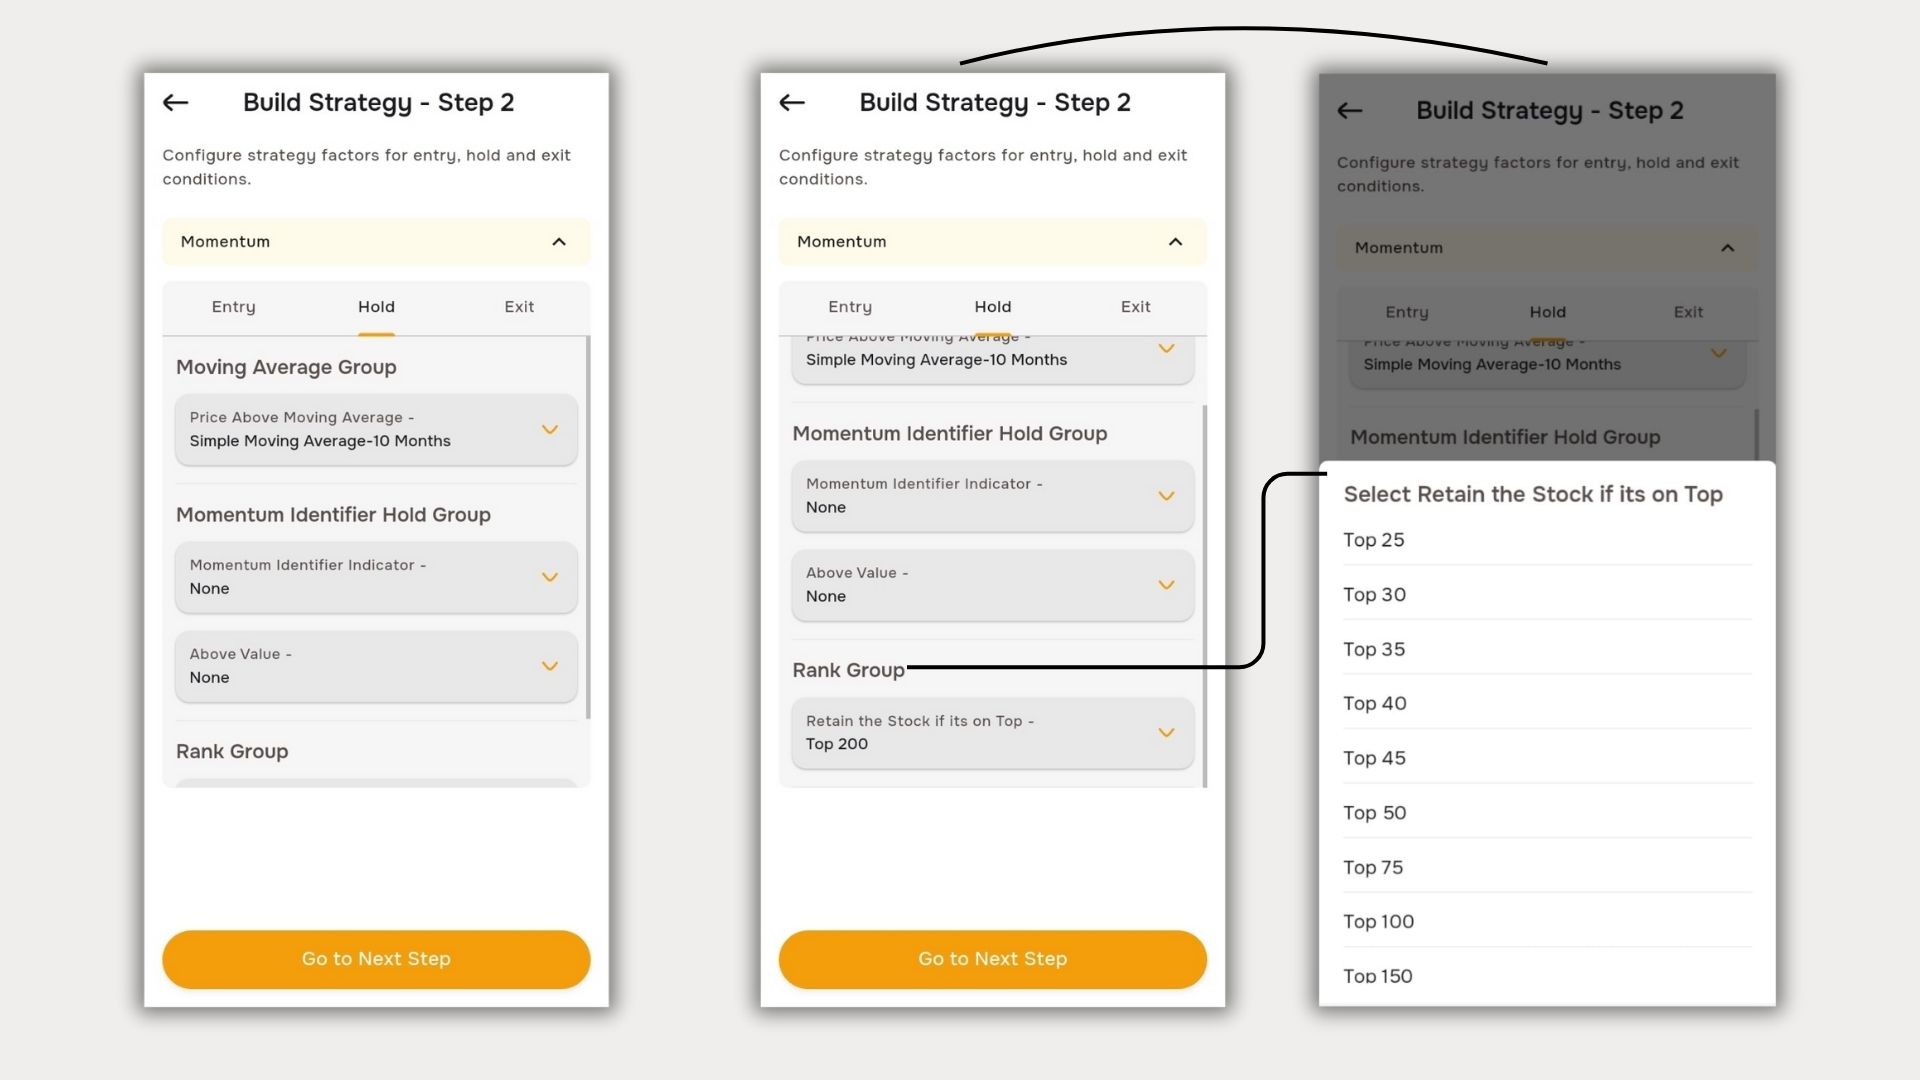
- Moving Averages: If a stock stays above a chosen moving average (e.g., SMA 10), it remains in the portfolio[cite: 40].
- Rank Group: Stocks ranking within a set range (e.g., Top 200) are retained (This Rank is Based on ROC Change)[cite: 40].
Exit Strategy – When to Sell
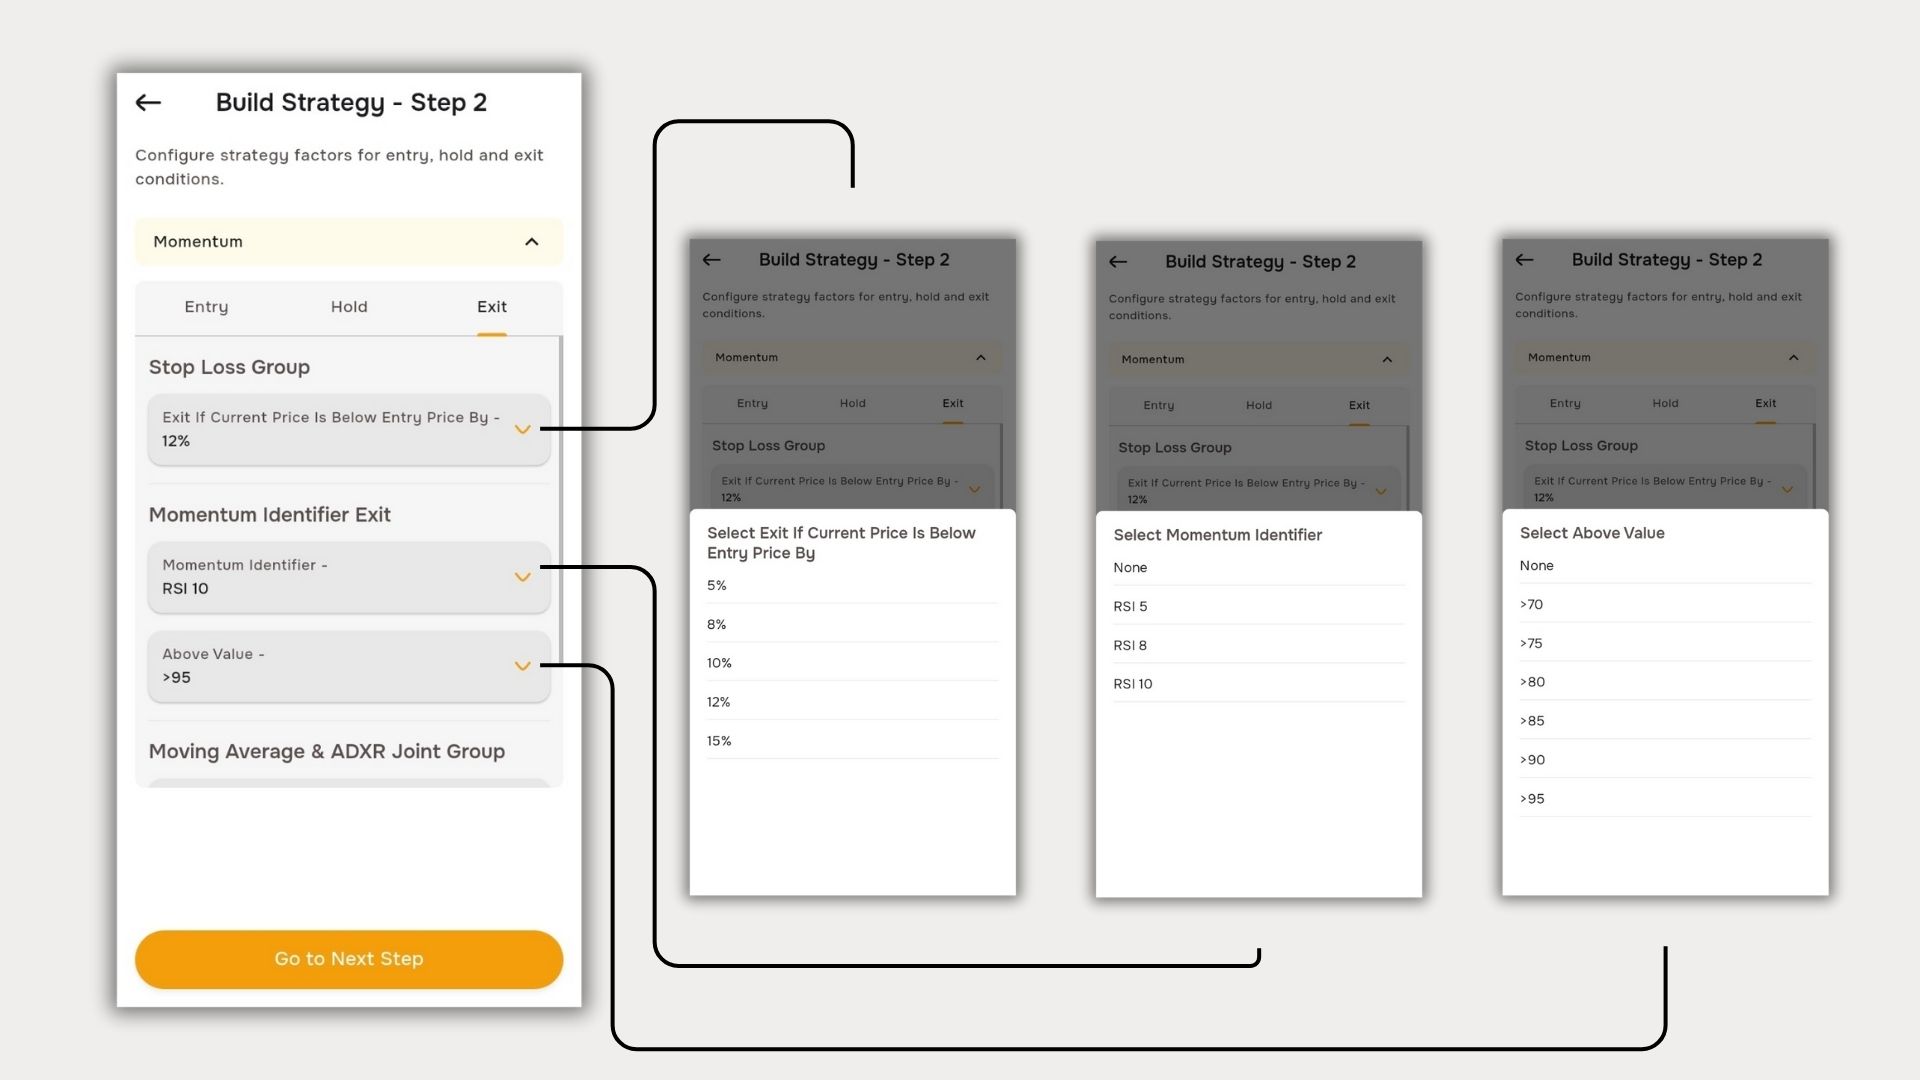
You can define multiple exit triggers, and if any one condition is met, the stock is sold[cite: 40].
- Stop Loss – Set the maximum percentage loss you can tolerate[cite: 40].
- Momentum-Based Exit – If momentum fades, exit is triggered[cite: 40].
Example: If RSI 10 > 95 is selected, the stock will exit as soon as its RSI crosses 95[cite: 40].
(Here, RSI 10 refers to the Relative Strength Index of the last 10 months rising above 95)[cite: 40]
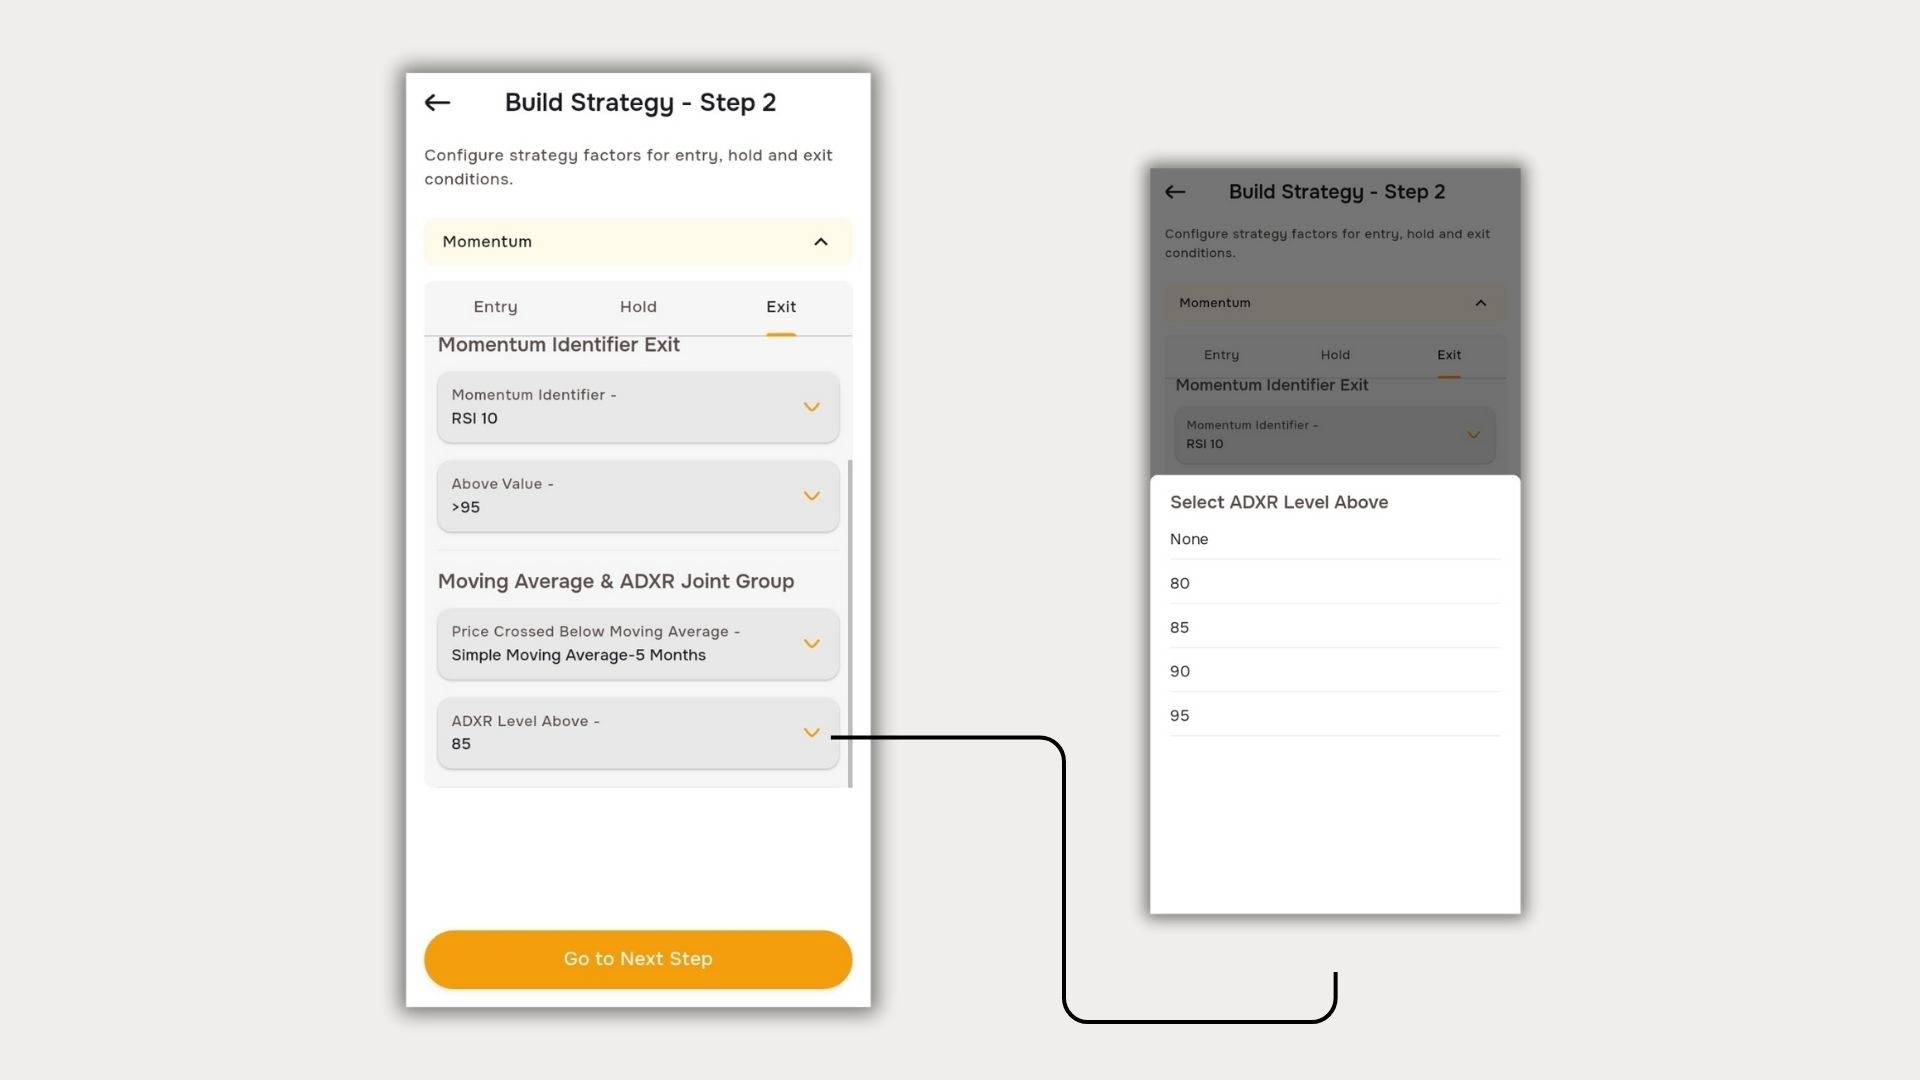
- Moving Averages – If the stock drops below a set moving average, it exits[cite: 40].
- Average Directional Index (ADXR) – Recognizes if the stock is likely to reverse[cite: 40].
Momentum investing works best when risk management is incorporated[cite: 40]. The ADXR Level helps identify strong reversal signals—stocks that hit a high ADXR level may be primed for a correction, and an exit ensures profits are secured before a potential drop[cite: 40].
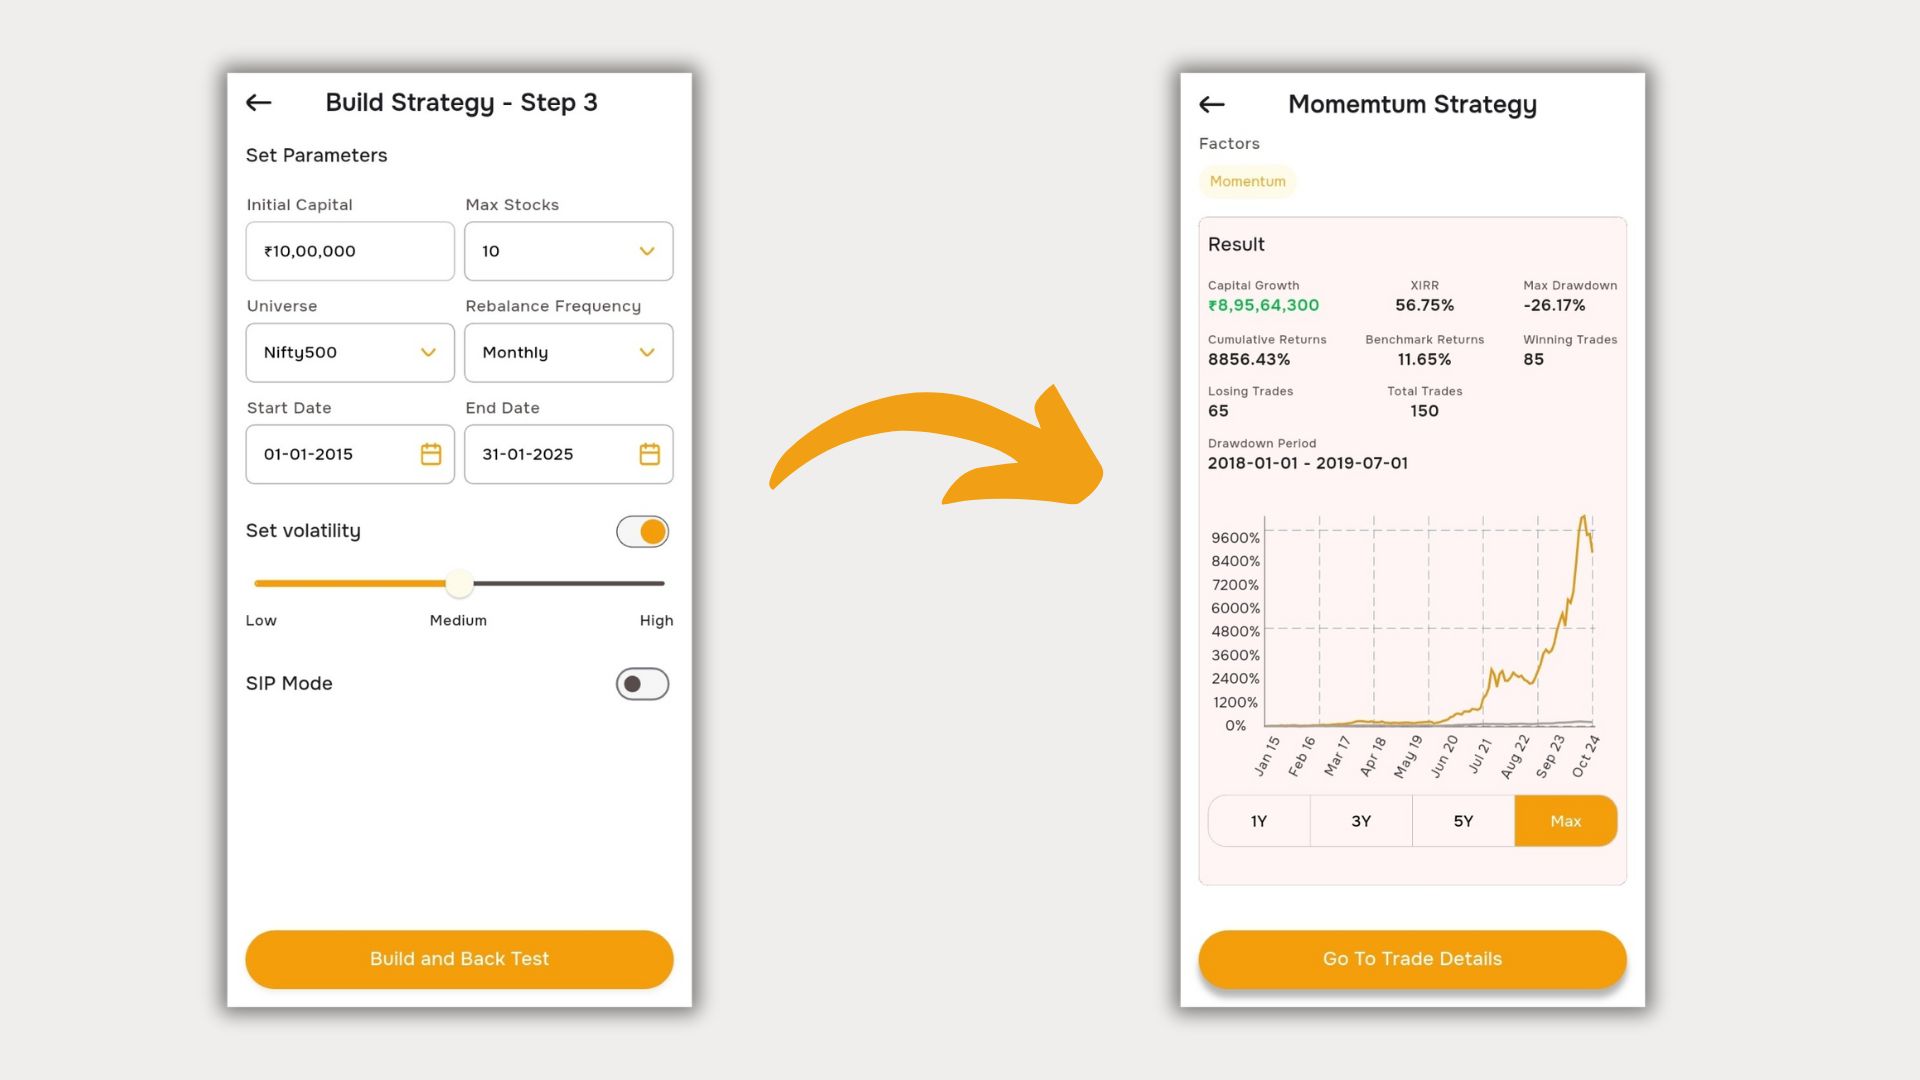
After selecting the required parameters, click on 'Go to Next Step[cite: 40].' This will take you to Step 3, where you can configure key settings such as Initial Capital, which defines the starting investment amount, Maximum Stocks to determine the maximum number of stocks included in the strategy, Universe to select the stock pool available for execution, Rebalancing Frequency to set how often the portfolio adjustments occur, Backtesting Date to analyze historical performance, and Volatility Constraints to manage risk and refine stock selection[cite: 40]. Once these parameters are set, clicking on 'Build & Backtest' will generate the results of your designed Momentum framework[cite: 40].
The Results Section will then display key performance metrics, including Capital Growth, which reflects the overall increase in investment value, CAGR (Compound Annual Growth Rate) to show the annualized return of the strategy, Maximum Drawdown to indicate the largest peak-to-trough decline, Cumulative Returns representing total returns over the backtest period, Benchmark Returns for market comparison, Winning & Losing Trades to break down profitable and unprofitable trades, and Total Trades Executed to track the number of trades completed[cite: 40].
Additionally, in the Trade Details section, you will find a categorized list of trades, including Live Trades, which are ongoing positions currently in the portfolio, and Past Performance, which provides a history of executed trades and their outcomes[cite: 40]. This detailed analysis ensures a comprehensive evaluation of the Momentum strategy's effectiveness[cite: 40].
With BossInvestor, you have a structured framework to:
- Enter at the right time[cite: 40]
- Ride the momentum trend[cite: 40]
- Exit before a downturn[cite: 40]
Start building your Momentum Strategy today and take control of your investments![cite: 40]
At BossInvestor, we provide a comprehensive backtesting feature that allows you to test your own momentum strategies backed by multiple factors[cite: 40].
Click the link below to understand how the Momentum Strategy is crafted and navigate through the application[cite: 40].
Click here to open the User Manual PDFBossInvestor is a SEBI Registered Research Analyst (INH000024143). Results shown are based on historical data and do not guarantee future performance[cite: 40].
Frequently Asked Questions
How do you screen for a momentum strategy in the Indian stock market?
Screening for a momentum strategy in the Indian stock market involves using technical filters to find companies exhibiting strong price velocity[cite: 40]. Investors frequently set quantitative parameters based on rate of change metrics or price distance from 52-week highs across liquid indices like the Nifty 500[cite: 40]. By combining these velocity screeners with moving averages, market participants ensure they are selecting equities locked into robust, sustained structural uptrends rather than isolated, low-volume price spikes[cite: 40].
What is the role of moving averages in validating a momentum strategy?
Moving averages serve as dynamic trend filters that validate whether price velocity is backed by sustained directional strength[cite: 40]. By requiring an asset's closing price to remain above specific metrics like a simple moving average or exponential moving average, the system systematically separates genuine institutional trends from erratic, short-term market noise[cite: 40]. This technical layer functions as a baseline verification check, confirming that the underlying broader momentum is healthy before capital is deployed into a position[cite: 40].
Why is risk management crucial when running a momentum strategy?
Risk management is critical because strong directional trends are inherently vulnerable to sharp, rapid structural reversals or sudden profit-taking corrections[cite: 40]. Implementing automated features like absolute percentage stop losses, relative strength index caps to avoid overbought zones, and directional trend indicators ensures capital protection[cite: 40]. These rule-based constraints protect accumulated profits and systematically remove underperforming positions before severe market drawdowns or sudden volatile trend shifts can erode the broader portfolio equity curve[cite: 40].
How does rebalancing frequency impact quantitative momentum strategy performance?
Rebalancing frequency determines how often an investment portfolio recalibrates to purge fading assets and reallocate capital into fresher trending equities[cite: 40]. In quantitative factor frameworks, selecting periodic cycles like weekly, monthly, or quarterly intervals prevents the strategy from holding stagnant positions whose price velocity has flattened[cite: 40]. Proper scheduling balances the capture of extended equity trends against the drag of higher trading costs and capital gains taxes associated with excessive portfolio turnover[cite: 40].
What metrics determine if a backtested momentum strategy is successful?
Evaluating historical strategy performance requires analyzing a combination of return-based and risk-adjusted metrics to ensure viability[cite: 40]. Key indicators include Compound Annual Growth Rate to evaluate annualized returns, total capital growth to map terminal value, and maximum drawdown to quantify the steepest peak-to-trough equity decline[cite: 40]. Comparing these figures against benchmark indices while tracking historical winning versus losing trade ratios provides a realistic representation of the portfolio framework's long-term statistical edge[cite: 40].
Related Blogs

Biocon Shares Jump 6% on Volume Breakout & Biosimilars Growth
Published: Thu Jul 16 2026Read more…

SBI Funds Management IPO Closes: ₹11,693 Cr Issue Sets Record
Published: Thu Jul 16 2026Read more…

Alok Industries Q1 FY27 Results Board Meeting Today
Published: Thu Jul 16 2026Read more…

ITC Hotels Slips 5% Despite 36% Jump in Q1 Net Profit
Published: Fri Jul 17 2026Read more…