Moving Averages Trading Strategy
Moving averages optimize entry, holding, and exit decisions in stock trading. Learn to use SMAs and EMAs for better risk management.

How do moving averages improve your trading strategy?
Moving averages simplify market analysis by continuous tracking of asset prices to identify reliable entry, holding, and exit signals[cite: 41]. By establishing systematic parameters for trends, they minimize emotional errors and protect capital during market volatility[cite: 41]. Incorporating these metrics across assets creates an objective, data-driven system for long-term portfolio execution[cite: 41].
Definition: A moving average is a foundational technical analysis tool that calculates the rolling average price of an asset over a predefined time frame[cite: 41]. This calculation effectively smooths out random short-term market fluctuations to expose the true underlying direction of the price trend[cite: 41].
Key Takeaways
- Simple Moving Averages compute the basic mathematical average over specified periods, while Exponential Moving Averages give higher priority to recent price data[cite: 41].
- Moving averages offer structured framework guidance for holding an asset during uptrends and triggering exits when trend reversals occur[cite: 41].
- The application of moving averages varies by individual style, ranging from short-term EMA tracking to long-term 200-day SMA trend filters[cite: 41].
- Technical trend metrics function uniformly across diverse asset categories, including domestic stocks, commodities, currencies, and market indices[cite: 41].
- Historical backtesting over a ten-year horizon reveals that applying moving average filters provides superior downside protection and lowers maximum drawdowns[cite: 41].
Our Essential Guide to Using Moving Averages for Entry, Holding, and Exit
In the complex world of investing, simple tools often become your best allies[cite: 41]. Moving averages (MAs) are one such tool fundamental, versatile, and powerful[cite: 41]. Whether you are a beginner trying to find a reliable way to identify market trends or a seasoned investor looking to refine your strategy, understanding moving averages can make a significant difference[cite: 41].
Moving averages don’t just help you find entry points in stocks or other assets; they also provide guidance on when to hold onto your positions and when to exit[cite: 41]. In this blog, we’ll explore the different types of moving averages, how to use them effectively, and why they should be part of every investor’s toolkit[cite: 41].
What is a Moving Average?
At its core, a moving average is the average price of an asset over a specified period, updated continuously as new prices come in[cite: 41]. This “moving” or rolling average smooths out price data, filtering short-term fluctuations and revealing the underlying trend[cite: 41].
Think of it like the average speed of a car over the last 10 minutes: while speed fluctuates every second, the average speed gives you a smoother picture of how fast you’ve been going[cite: 41].
Types of Moving Averages:
The most popular moving averages are:[cite: 41]
- Simple Moving Average (SMA): The SMA is the straightforward average of prices over a chosen number of periods[cite: 41]. For example, a 20-day SMA adds up the closing prices of the last 20 days and divides by 20[cite: 41]. Each day, the oldest price drops out, and the newest price is added, creating a “moving” average[cite: 41].
- Exponential Moving Average (EMA): Unlike SMA, EMA gives more weight to recent prices, making it more responsive to recent market changes[cite: 41]. This makes EMA faster at reflecting recent price movements, which some investors prefer for more timely signals[cite: 41].
- Weighted Moving Average (WMA): WMA also assigns weights to prices but does so linearly the most recent price gets the highest weight, and the weights decrease uniformly for older prices[cite: 41]. It sits somewhat between SMA and EMA in responsiveness[cite: 41].
Each type has its own advantages, depending on your investing style and time horizon[cite: 41].
Moving Averages: Beyond Entry Holding and Exit Decisions
Most DIY investors first learn moving averages as a way to spot good entry points “buy when price crosses above the moving average[cite: 41].” While this is useful, moving averages offer much more[cite: 41].
Holding:
Once you buy, moving averages can help you decide whether to continue holding[cite: 41]. For example, if you buy when the price crosses above the 50-day SMA, you may choose to hold as long as the price stays above it, riding the uptrend[cite: 41]. This systematic approach helps avoid panic selling during short-term dips[cite: 41].
Exit:
Exiting at the right time is as important as entering at the right time[cite: 41]. A drop below a key moving average can signal trend weakness or reversal, prompting you to reduce or exit your position[cite: 41]. Using moving averages as exit triggers reduces emotional decisions and helps preserve capital[cite: 41].
Why this matters:
Markets are volatile and emotions often cloud judgment[cite: 41]. Moving averages provide a mechanical, emotion-free framework that helps you stay invested in winning trends and exit losing ones in a timely fashion[cite: 41].
No Standard Use It’s Your Style, Your Rules
There is no universally “correct” way to use moving averages[cite: 41]. Different investors and traders have their own styles based on risk tolerance, timeframe, and market preferences[cite: 41].
- Short term traders might use 10 or 20-day EMAs to catch quick moves but accept more false signals[cite: 41].
- Medium term investors often prefer 50-day or 100-day SMAs for balanced responsiveness and smoothing[cite: 41].
- Long term investors or conservative portfolio managers might use the 200-day SMA to filter out noise and identify the broad trend[cite: 41].
Some combine multiple MAs for crossover signals (e.g., the “golden cross” of 50-day crossing above 200-day)[cite: 41]. Others use moving averages purely as dynamic support or resistance levels[cite: 41].
Your key takeaway? Experiment, backtest, and find what fits your comfort level[cite: 41]. Be consistent once you find your method[cite: 41].
Moving Averages Are Not Just for Stocks Use Them Across Assets
Moving averages are simple mathematical tools their power comes from the way they clarify trends, not from what asset you apply them to[cite: 41].
They work equally well for:[cite: 41]
- Commodities: Like gold, crude oil where trends can be volatile but MAs smooth out noise[cite: 41].
- Currencies: In forex markets, MAs help identify trend direction and potential reversal points[cite: 41].
- Cryptocurrencies: Given their volatility, faster-moving averages like EMA can help capture quick trends[cite: 41].
- Indices and ETFs: For broad market exposure or sector rotation strategies[cite: 41].
This universality means once you master moving averages, you can apply them in any market[cite: 41].
Common Pitfalls and How to Avoid Them
Moving averages are powerful but not foolproof[cite: 41]. Here are some common mistakes investors make:[cite: 41]
- Chasing moving averages: Jumping in immediately when price crosses above an MA without confirming volume or other factors can lead to whipsaws[cite: 41].
- Ignoring the timeframe: Using a short-term MA in a long-term investing strategy (or vice versa) causes mixed signals[cite: 41].
- Blindly following crossovers: Not all crossovers indicate strong trends; sometimes, markets “fake out” and reverse[cite: 41]. Confirm with other indicators or price action[cite: 41].
- Overcomplicating: Adding too many moving averages can confuse signals rather than clarify[cite: 41].
The best approach is to use moving averages as a part of a broader decision-making framework, not as the sole determinant[cite: 41].
Practical Tips for Investors
- Choose MA periods aligned to your time horizon: Longer MAs for long-term, shorter MAs for short-term[cite: 41].
- Use MA as dynamic support/resistance: Prices often bounce off major moving averages during trends[cite: 41].
- Combine with volume and price patterns: Confirm MA signals with other data points[cite: 41].
- Be patient: Sometimes moving averages lag; combine them with price action to avoid premature exits or entries[cite: 41]
- Backtest your strategy: Use historical data to see how your chosen MAs would have worked on your target assets[cite: 41].
How We at BossInvestor Use Moving Averages
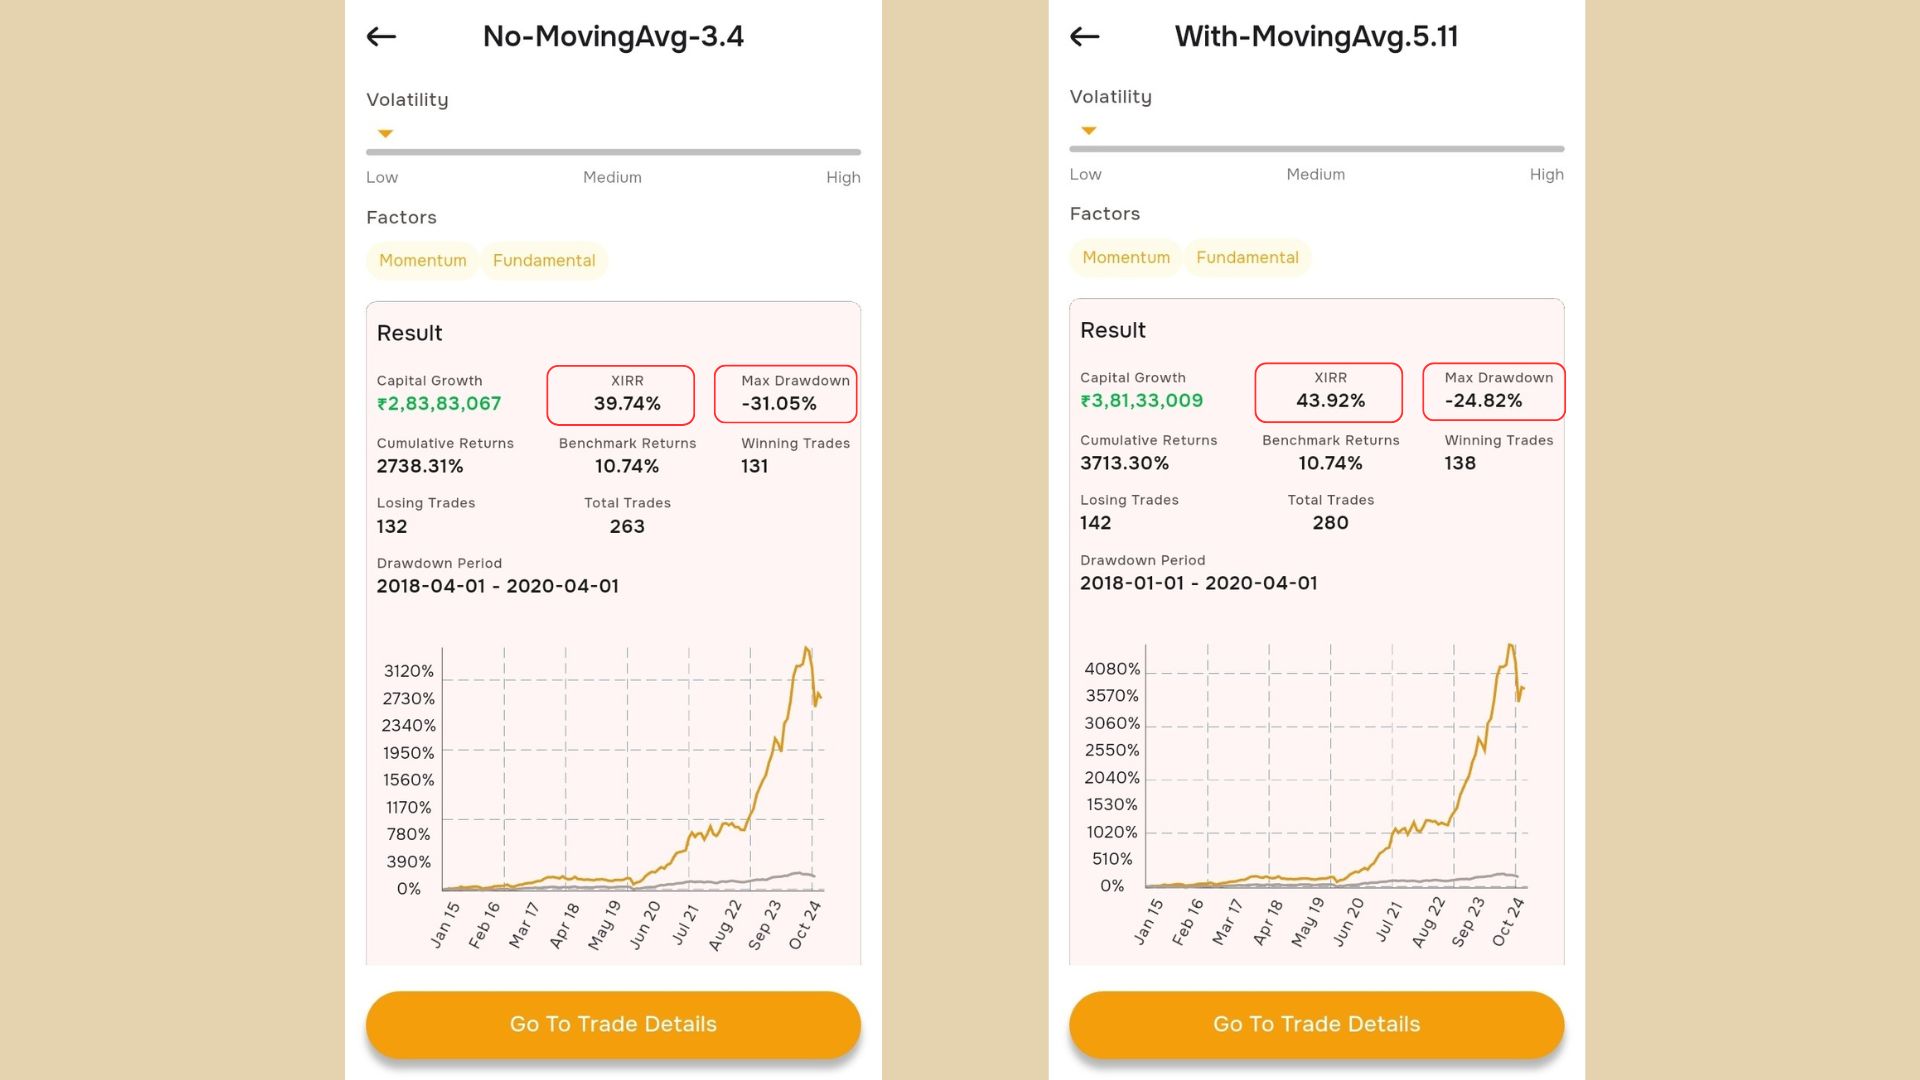
We have backtested stocks with a market cap greater than ₹1,000 crore, using an initial capital of ₹10 lakh, for a maximum 15-stock portfolio rebalanced on a quarterly basis[cite: 41].
At BossInvestor, we don’t just talk about moving averages we test them[cite: 41]. Through our Backtesting feature, investors can clearly see how moving averages impact not just stock selection, but also holding duration and exit timing[cite: 41]. We treat moving averages as a measure of trend strength a way to stay in sync with the market’s rhythm[cite: 41].
To illustrate this, we’ve included two sets of backtesting results below:[cite: 41]
- Scenario 1: Strategy with no moving average filters applied[cite: 41].
- Scenario 2: Strategy where moving averages are applied across entry, hold, and exit decisions[cite: 41].
You’ll notice a significant difference in drawdowns and the consistency of returns[cite: 41]. Over a 10-year horizon, strategies using moving averages demonstrate better downside protection and smoother compounding helping DIY investors avoid emotional exits during short-term volatility[cite: 41].
Note: PEG and PE ratios were also considered as part of the entry criteria in this backtest[cite: 41]. This comparison is solely intended to highlight the role of Moving Averages for a clearer picture[cite: 41]. The strategy with Moving Averages can be further enhanced by combining it with other fundamental parameters to achieve better results in terms of drawdown and winning trades[cite: 41].
Stay tuned — we’re launching this backtesting feature soon![cite: 41]
Before You Conclude, Use Moving Averages But Don’t Rely on Them Alone
Moving averages are powerful, no doubt they help spot trends, provide structure, and guide entries and exits[cite: 41]. But should you deploy capital just because a stock crossed above its 50-day or 200-day line? Not quite[cite: 41]. At BossInvestor, we go a step further[cite: 41]. Our momentum theory is built on a foundation of strong fundamentals - earnings growth, solid balance sheets, and consistent performance[cite: 41]. This combination of technical signals and financial strength offers double confirmation, giving us the confidence to act decisively[cite: 41]. So while moving averages can be your guide, fundamentals should be your compass together, they create a smarter, more reliable path to long-term success[cite: 41].
BossInvestor is a SEBI Registered Research Analyst (INH000024143). Results shown are based on historical data and do not guarantee future performance[cite: 41].
Frequently Asked Questions
What is the difference between SMA and EMA in Indian stock trading?
Simple Moving Average calculates an unweighted mean of closing prices over a set period, treating all trading sessions equally[cite: 41]. Conversely, the Exponential Moving Average applies a mathematical multiplier that assigns higher significance to recent price data[cite: 41]. For market participants in India looking to analyze volatile equity benchmarks, EMAs respond rapidly to structural news breaks and immediate price changes[cite: 41]. SMAs react more deliberately, filtering out ambient short-term market noise to project reliable core trend trajectories over expanded, long-term operational horizons[cite: 41].
How do technical trend indicators protect capital during an NSE market correction?
Technical indicators like moving averages act as automated protective boundaries during systemic sell-offs on the National Stock Exchange[cite: 41]. When the market price of an equity position breaks decisively below a primary institutional support level, such as the 50-day or 200-day simple moving average, it serves as an empirical warning of structural trend failure[cite: 41]. Initiating partial liquidations or complete portfolio exits based on these systematic triggers overrides psychological biases, significantly limits portfolio drawdowns, and preserves capital for subsequent reallocations[cite: 41].
Why should an investor combine moving average criteria with fundamental analysis?
Relying exclusively on price filters can expose market participants to deceptive market swings and false breakouts during sideways consolidation phases[cite: 41]. Marrying technical trends with core financial data points ensures capital is deployed effectively[cite: 41]. For instance, requiring robust earnings trajectories, strong return on equity metrics, and sound corporate balance sheets ensures an investor selects fundamentally sound underlying companies[cite: 41]. Layering technical metrics over these filters confirms institutional market momentum, optimizing transaction timing and baseline stability[cite: 41].
What is a golden cross pattern and how is it interpreted?
A golden cross takes place when a shorter-term trend line crosses decisively above a slower, long-term baseline indicator from below[cite: 41]. In classical technical analysis, the most prominent iteration is the 50-day simple moving average scaling above the 200-day simple moving average[cite: 41]. This specific mechanical shift demonstrates a powerful acceleration in near-term price velocity relative to historical distributions[cite: 41]. Market analysts interpret this layout as a major structural transition from an enduring bear cycle into a sustainable long-term bull market trend[cite: 41].
How do you select the correct period length for analyzing equity trends?
Selecting optimum parameter lengths depends entirely on an investor's personal operational timeframe and core risk profile[cite: 41]. Swing traders frequently utilize brief, agile windows like 10-day or 20-day exponential lines to capture quick price expansions[cite: 41]. Position managers usually opt for balanced 50-day and 100-day metrics to navigate medium-term fluctuations[cite: 41]. Long-term wealth builders rely predominantly on 200-day simple moving averages to track macroeconomic market cycles while minimizing portfolio over-trading and administrative transaction overheads[cite: 41].
Related Blogs

Biocon Shares Jump 6% on Volume Breakout & Biosimilars Growth
Published: Thu Jul 16 2026Read more…

SBI Funds Management IPO Closes: ₹11,693 Cr Issue Sets Record
Published: Thu Jul 16 2026Read more…

Alok Industries Q1 FY27 Results Board Meeting Today
Published: Thu Jul 16 2026Read more…
ITC Hotels Slips 5% Despite 36% Jump in Q1 Net Profit
Published: Fri Jul 17 2026Read more…