Proven Investment Framework Portfolio Guide
Proven investment framework to build a winning portfolio in the Indian stock market by combining momentum filters and core business fundamentals.

How Do You Build a Winning Portfolio Using a Proven Investment Framework?
Building a resilient, high-performing portfolio requires an investment framework that adapts dynamically to changing market regimes rather than relying on static predictions[cite: 37]. Integrating momentum filters alongside fundamental growth criteria allows investors to capture upside across economic expansions while executing rules-based risk management to contain drawdowns during corrections[cite: 37]. This systematic combination systematically protects capital and targets alpha in under-researched market spaces[cite: 37].
Definition: An investment framework is a structured, rules-based methodology utilized to screen, select, size, and rebalance a collection of financial securities based on quantifiable parameters[cite: 37]. It establishes objective operational boundaries for managing position concentration, market style tilts, and exit signals to remove emotional bias from capital allocation[cite: 37]. By standardizing asset criteria, it ensures repeatable execution across diverse market conditions[cite: 37].
Key Takeaways
- Indian financial markets remain predominantly driven by active management, presenting significant alpha opportunities for individual investors in the under-researched small and midcap segments[cite: 37].
- A high-conviction portfolio structured with an optimized concentration of ten to fifteen stocks effectively maximizes diversification benefits before performance advantages begin to plateau[cite: 37].
- Relying exclusively on pure price momentum strategies yields high historical returns but exposes capital to severe portfolio drawdowns exceeding thirty percent without fundamental risk controls[cite: 37].
- Layering quantitative growth metrics alongside core fundamental quality filters significantly drops maximum strategy drawdowns while maintaining robust long-term performance metrics[cite: 37].
- A dynamic rules-based model automatically reduces overall equity exposure during structural momentum slowdowns to actively preserve investor capital without relying on subjective forecasting models[cite: 37].
The Need for a DIY Portfolio
India is still predominantly an active fund market[cite: 37]. Unlike the mature U.S. markets, where passive investing and index-based strategies dominate, Indian markets are far from being fully discovered[cite: 37]. This creates ample opportunities for investors to uncover alpha—if they know where to look[cite: 37].
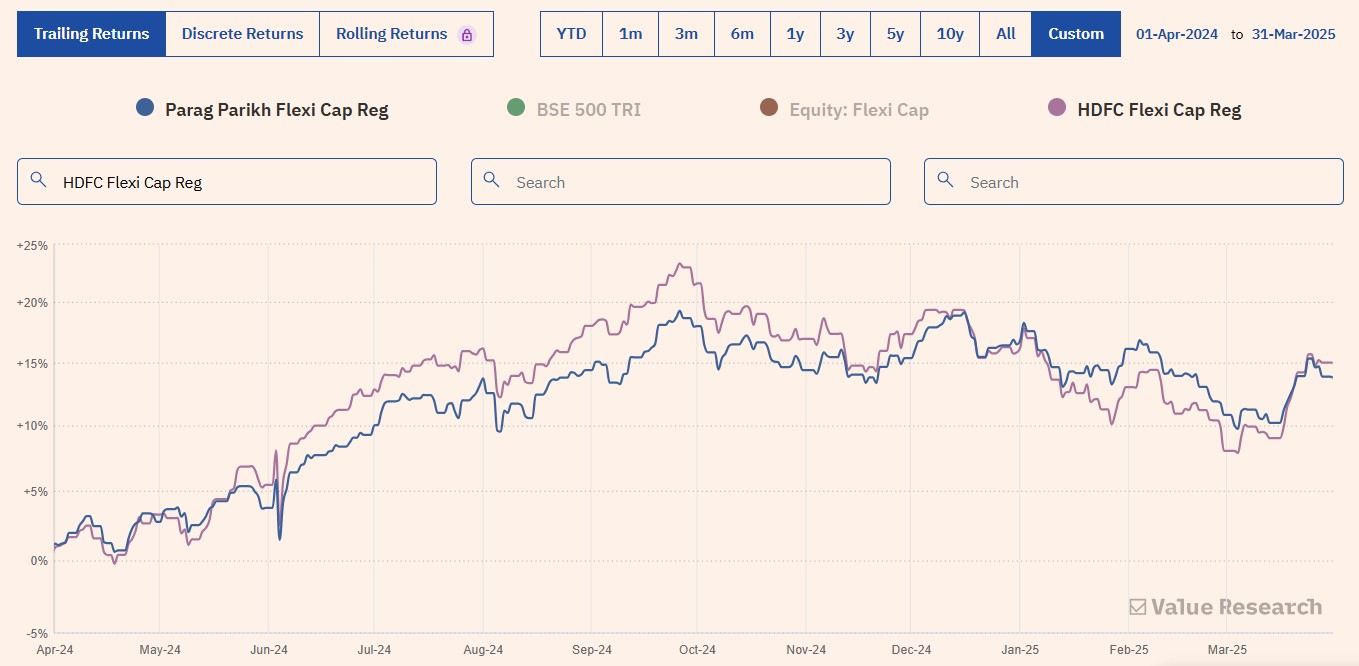
Even in FY24–25, mutual funds like HDFC Flexi Cap and PPFAS delivered strong returns, especially in large caps[cite: 37]. What set them apart? A robust, disciplined process[cite: 37]. But more importantly, they weren’t strictly passive or blindly diversified[cite: 37]. They made informed, high-conviction bets[cite: 37].
That said, a common complaint from many investors is that most mutual funds don’t venture beyond the Nifty 200 universe[cite: 37]. Their portfolios often look the same, which limits diversification and potential outperformance[cite: 37]. This opens a huge opportunity for DIY investors[cite: 37].
If you want to build your own portfolio and unleash the potential of SMID (Small & Midcap) stocks, you need a clear, structured framework[cite: 37].
How We Construct Our Portfolio at BossInvestor
We’re Theme-Agnostic, Market-Regime Aware
We don’t stick to one fixed style[cite: 37]. Instead, we adapt to changing market conditions while filtering stocks through a multi-factor lens: momentum, fundamentals, valuation, growth, and market share[cite: 37].
Because market regimes change, so should your investing style[cite: 37]. Here's how different styles work across regimes:[cite: 37]
- Economic Expansion → Growth works best[cite: 37]
- Economic Uncertainty → Quality shines[cite: 37]
- Downturn/Bear Markets → Low volatility, low-risk strategies work[cite: 37]
- Liquidity-Driven Bulls → Momentum dominates[cite: 37]
- Rising Interest Rates / Liquidity Withdrawal → Value investing outperforms[cite: 37]
A successful portfolio doesn’t just chase returns[cite: 37]. It aims to minimize drawdowns across cycles while keeping long-term return expectations intact[cite: 37]. Less stress, better sleep[cite: 37].
Portfolio Construction: The BossInvestor Way
- No. of Stocks: 10–15[cite: 37]. Beyond that, diversification benefits plateau[cite: 37].
- Universe: Any stock with Market Cap > ₹1,000 Cr[cite: 37]
- Rebalancing: Quarterly or Monthly, depending on market shifts[cite: 37]
- Position Sizing: Equal-weighted at entry (10 stocks = 10% each)[cite: 37]
- Cash Allocation: Cash is reallocated across the selected stock positions during each rebalancing[cite: 37].
The Funnel of Stock Selection

We filter stocks through this funnel:[cite: 37]
- Momentum: Investing in momentum stocks helps avoid value traps, even if it means buying at slightly higher valuations[cite: 37]. This approach ensures that capital isn't stuck for several quarters or years - as seen with stocks like HUL in 2000-2010 and Reliance during 2009–2017[cite: 37]. However, it's important not to buy at extremely high valuations — we'll cover how to avoid that in the checklist below[cite: 37].
- Growth: India is a growth-driven market, so growth stocks typically trade at higher valuations than value stocks[cite: 37]. The only exception is during a value investing phase[cite: 37]. However, even in such phases, momentum often picks up value stocks once they start rising[cite: 37]. That’s why, in most cases, it’s better to focus on growth companies — ideally those with revenue growth over 10% and EPS growth over 20%[cite: 37].
- Fundamentals: We focus on companies with a Return on Equity (ROE) greater than 10%, as it reflects the company’s financial strength and efficiency[cite: 37]. We also consider operating margins to ensure the business is profitable we avoid investing in loss-making companies[cite: 37]. Additionally, we selectively use the Debt-to-Equity (D/E) ratio: typically favoring D/E < 0.5 for low-debt companies, or D/E > 4 when analyzing banks and NBFCs, where higher leverage is part of the business model[cite: 37].
- Valuations: Value investing tends to perform well during periods of rising interest rates and tightening liquidity[cite: 37]. For example, the ICICI Value Discovery Fund delivered strong returns during the value investing phase that began in October 2021[cite: 37]. However, during growth periods, we shift focus to the PEG ratio — which is essentially a value lens applied to growth[cite: 37]. It helps ensure we're not overpaying and are getting higher growth at a reasonable price[cite: 37].
Adapting to Market Regimes
We don’t try to predict regime changes[cite: 37].
Instead, our momentum filters detect shifts[cite: 37]. As market preferences evolve, new winners emerge — and their prices start moving up[cite: 37]. That’s when they appear on our radar[cite: 37]. This passive detection lets us adapt quickly[cite: 37].
We backtested some combinations — starting with pure momentum and gradually layering in filters for growth, fundamental and value[cite: 37]. The goal was to see how each layer impacts returns and drawdowns[cite: 37].
Backtest Parameters:
- Investment Amount: ₹10 lakh[cite: 37]
- Universe: Stocks with market cap above ₹1,000 crore[cite: 37]
- Rebalancing Frequency: Monthly[cite: 37]
- Portfolio Size: 15 stocks[cite: 37]
- Testing Period: 1 Jan 2021 to 31 Mar 2025[cite: 37]
Backtest Results:
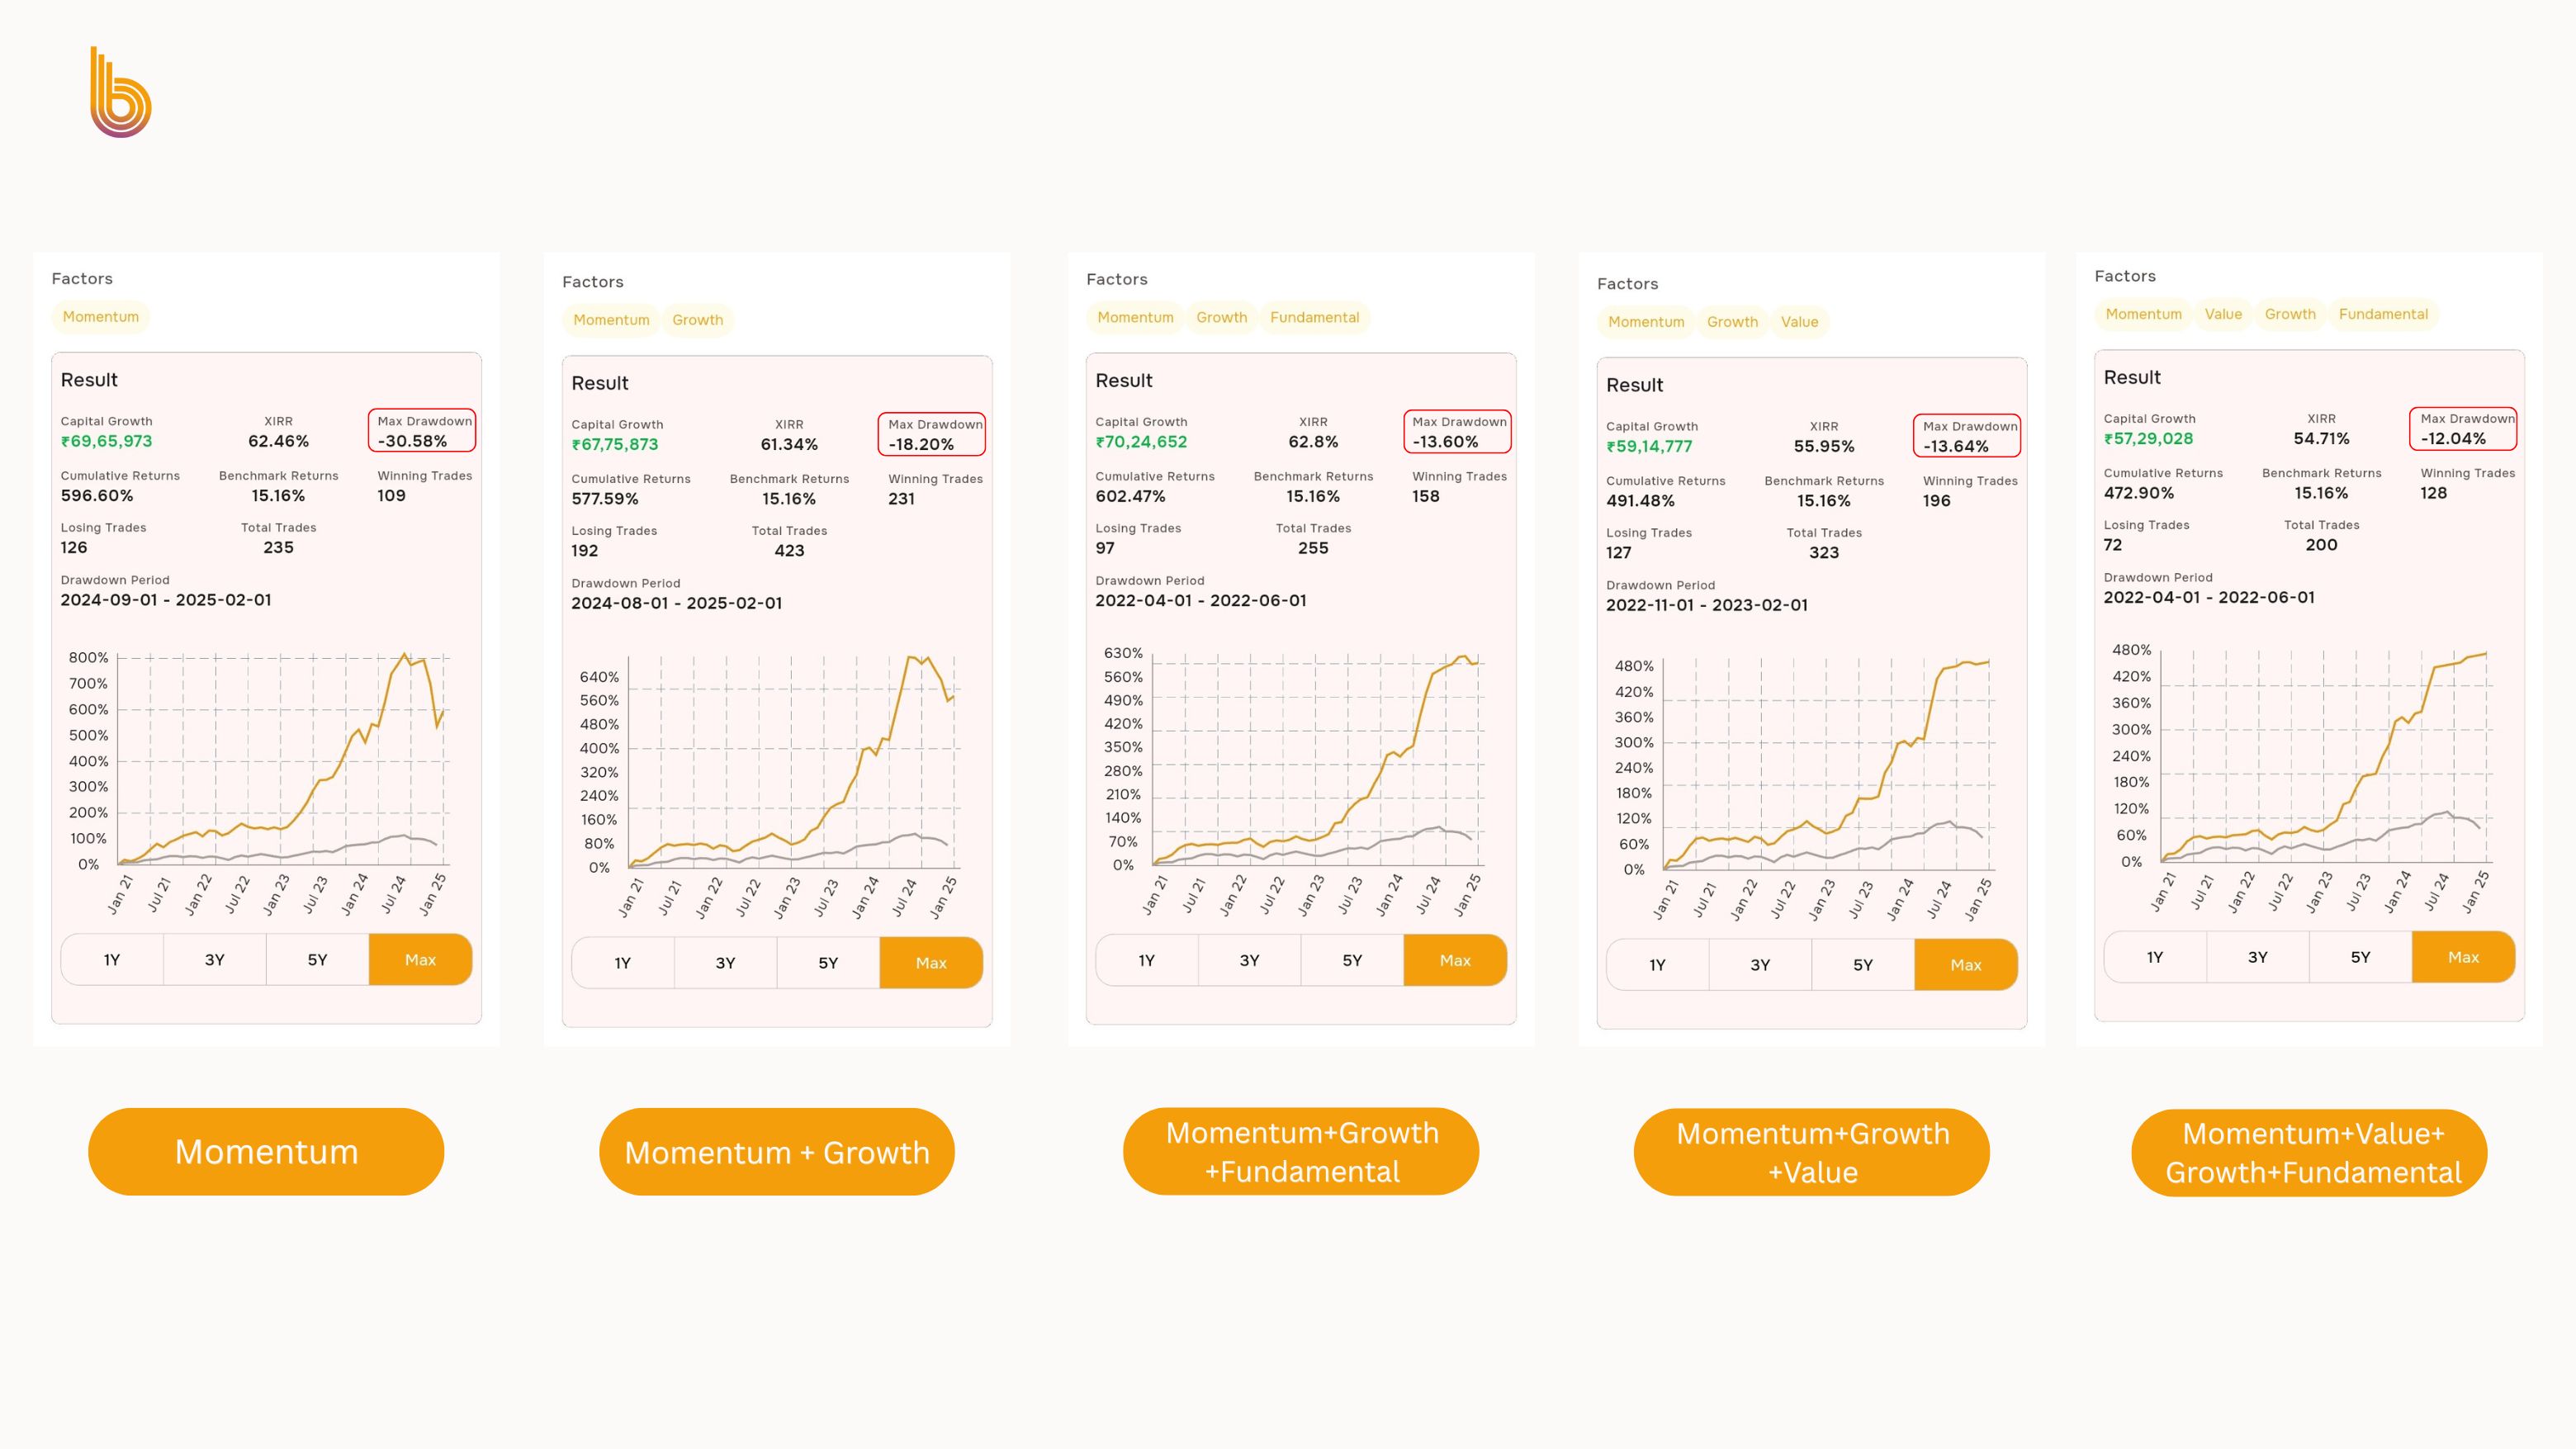
- Momentum Only – This approach tends to deliver high returns but comes with higher drawdowns due to limited risk controls[cite: 37]. As shown above, the drawdown is 30.58%, while the XIRR is 62.46%[cite: 37].
- Momentum + Growth – Adding growth filters helps select fundamentally stronger companies, leading to improved returns and reduced drawdowns[cite: 37]. The drawdown drops to 18.20% and XIRR rises to 61.34%[cite: 37].
- Momentum + Growth + Fundamentals – Incorporating fundamental quality checks increases reliability, though performance may vary based on the filters used[cite: 37]. In this case, the drawdown is 13.60% and XIRR is 62.8%, possibly due to overly strict or misaligned criteria[cite: 37].
- Momentum + Growth + Value – This blend balances price strength with growth potential and reasonable valuations[cite: 37]. It offers a good trade-off between performance and risk[cite: 37]. The drawdown is 13.64% and XIRR stands at 55.95%, making it a more stable alternative to pure momentum without sacrificing too much return[cite: 37].
- Momentum + Growth + Fundamentals + Value – Since the PEG ratio already integrates valuation, additional value filters (like DCF) are optional and may be used for further refinement[cite: 37]. Here, the XIRR is 54.71% and drawdown is 12.04%, suggesting the need for better alignment between filters[cite: 37].
We don't rely on predicting the future[cite: 37]. DCF, while useful, is based on assumptions of future growth and present-day discount rates[cite: 37]. Instead, our model focuses on price action, present fundamentals, and reasonable valuations[cite: 37].
Why This Works
Most traditional equity research assumes too many variables about the future growth and the valuation / DCF becomes subjective[cite: 37]. Many times it doesn’t work as per expectations and specially overhyped stories don’t play out[cite: 37]. We don’t assume anything and we try to avoid working with too many assumed variables[cite: 37].
- Focus on strong fundamentals — because real profits and returns are what sustain stock price appreciation in the long run[cite: 37].
- Seek reasonable valuations — we may pay up slightly during momentum phases, but we avoid the trap of chasing overvalued stocks[cite: 37].
- Ride momentum up — because price is the ultimate signal of market consensus, and entry at the right time improves reward-to-risk[cite: 37].
- Exit when momentum fades — this protects capital, avoids large drawdowns, and ensures capital is always working in strong opportunities[cite: 37].
This blend of quality + price action helps us build a dynamic, disciplined, and alpha-generating portfolio — without relying on market timing or prediction[cite: 37].
Here’s what we’ve noticed in 2024-2025
- May 2024: Our model held around 15 stocks as the overall market momentum was strong[cite: 37].
- October 2024: Started automatically selling a few positions without adding new stocks[cite: 37]. This indicated that the overall momentum is slowing down[cite: 37].
- January 2025: Sold most holdings, we were sure here that the market is falling now but the systematic selling helped us to minimize the drawdown[cite: 37].
- March 2025: Early signs of recovery are emerging, with promising stocks starting to show strength such as Bajaj Finance, Shree Cement, JK Cement, and Indigo[cite: 37]. We are seeing that our 15 stocks portfolio is able to pick up 4 to 5 stocks but we are still mid-way when we are writing this blog in April 2025[cite: 37].
This shows how a dynamic system can protect capital during drawdowns and quickly reposition when market strength returns[cite: 37].
The Three “Prices” We Pay and Why It’s Worth It
We believe it's well-suited for today's fast-paced, information-driven markets where price discovery happens much quicker than in the past — often influenced by global geopolitical events[cite: 37]. In such an environment, the traditional "buy and hold" strategy is losing its edge[cite: 37]. Even Warren Buffett no longer holds 75% of his portfolio for more than two years[cite: 37].
- Higher Portfolio Churn: This leads to more frequent buying and selling, making our strategy ideal for investment horizons ranging from a quarter to under two years[cite: 37].
- Higher Taxes: Yes, we incur more short-term capital gains tax compared to a long-term strategy[cite: 37]. But we consider this a reasonable cost to avoid getting stuck in underperforming or stagnant stocks — often referred to as value traps[cite: 37].
- Exclusion of IPOs: We stay away from these due to a lack of historical performance data[cite: 37].
Backtests consistently support our approach, and we stay grounded in Buffett’s timeless wisdom: "Rule No. 1: Never lose money. Rule No. 2: Never forget Rule No. 1."[cite: 37]
This Isn’t Trend-Chasing. It’s Data-Backed Discipline.
We call it “Momentum-Backed Fundamentals” — a hybrid philosophy where data leads and fundamentals validate[cite: 37].
In a world full of noise, hype, and headline-driven moves, it’s easy to fall into story traps — narratives built on rosy projections, charismatic promoters, and sector fads[cite: 37]. But we don’t play that game[cite: 37].
Instead, we follow a structured process rooted in what actually works:[cite: 37]
- Staying away from loss-making tech and speculative names[cite: 37]
- Focusing on hard numbers — growth, margins, returns on capital[cite: 37]
- Letting price confirm quality through momentum[cite: 37]
- Exiting when momentum fades or fundamentals weaken[cite: 37]
This is not about chasing what’s hot — it’s about positioning in real strength[cite: 37]. It’s a rules-based, repeatable system that keeps your capital working in the right places — and out of harm’s way[cite: 37].
Because in the long run, truth shows up in price, and price follows performance[cite: 37].
That’s the discipline behind BossInvestor — simple, logical, data-backed investing[cite: 37]. Nothing flashy[cite: 37]. Just results[cite: 37].
Try It Yourself
Download the app and subscribe to our BossInvestor Model Portfolio[cite: 37]. It follows this exact philosophy[cite: 37]. Or customize your own using our Backtester Tool—set your own rules, filters, and see what works[cite: 37].
Read the Backtester Blog — Discover how it's more powerful than traditional screeners[cite: 37].
BossInvestor is a SEBI Registered Research Analyst (INH000024143). Results shown are based on historical data and do not guarantee future performance[cite: 37].
Frequently Asked Questions
How does an equity investment framework minimize emotional errors during Indian market corrections?
An equity investment framework removes subjective biases by establishing explicit, pre-defined rules for both entries and exits[cite: 37]. Instead of reacting to media noise or panic during a market downturn, the framework utilizes quantitative parameters like price relative strength or momentum deterioration to trigger automatic sales[cite: 37]. This systematic execution actively minimizes drawdowns and helps preserve capital, protecting individual portfolios from holding onto severe laggards throughout extended market corrections[cite: 37].
Why do rules-based model portfolios intentionally limit total stock exposure to fifteen names?
Limiting portfolio concentration to ten or fifteen carefully vetted holdings prevents over-diversification, which frequently dilutes net outperformance and drags performance closer to baseline market averages[cite: 37]. Empirical data demonstrates that the marginal statistical risk reduction obtained by adding more names plateaus significantly after fifteen stocks[cite: 37]. Maintaining a tighter focus allows each high-conviction allocation to move the performance needle substantially while remaining manageable for rigorous fundamental tracking[cite: 37].
What are the tax implications of utilizing a hybrid momentum investment framework in India?
A hybrid system that incorporates price momentum naturally exhibits higher portfolio turnover due to regular quarterly or monthly rebalancing rules[cite: 37]. For Indian market participants, this accelerated trading activity results in a higher frequency of realized short-term capital gains tax rather than long-term tax rates[cite: 37]. However, this increased transaction cost is viewed as a calculated structural trade-off to systematically evade severe value traps and maximize capital deployment in winning companies[cite: 37].
How do fundamental filters like Return on Equity alter risk outcomes in momentum strategies?
Pure price momentum models excel at capturing rapidly escalating trends but occasionally buy into overvalued speculative names that lack institutional backing or real operational earnings[cite: 37]. Integrating strict fundamental hurdles, such as requiring a Return on Equity above ten percent and positive operating profit margins, filters out weak balance sheets[cite: 37]. This ensures that the underlying price trend is validated by actual corporate profitability, dramatically reducing strategy drawdowns[cite: 37].
Why does this quantitative model favor the Price to Earnings Growth ratio over discounted cash flows?
Discounted cash flow models are deeply dependent on highly subjective long-term assumptions regarding growth trajectories and present-day macro discount rates, which frequently fail to materialize in volatile segments[cite: 37]. The Price to Earnings Growth ratio acts as an objective, immediate valuation lens applied specifically to accelerating companies[cite: 37]. It directly connects current market pricing to near-term earnings delivery, ensuring that investors pay a reasonable price relative to actual corporate growth rates[cite: 37].
Related Blogs

Biocon Shares Jump 6% on Volume Breakout & Biosimilars Growth
Published: Thu Jul 16 2026Read more…

SBI Funds Management IPO Closes: ₹11,693 Cr Issue Sets Record
Published: Thu Jul 16 2026Read more…

Alok Industries Q1 FY27 Results Board Meeting Today
Published: Thu Jul 16 2026Read more…

ITC Hotels Slips 5% Despite 36% Jump in Q1 Net Profit
Published: Fri Jul 17 2026Read more…