What Defines Momentum in Stocks?
Momentum in stocks drives systematic returns. Learn how BossInvestor uses structured technical indicators like RSI and ROC to capture strong market trends.

What defines momentum in stocks?
Momentum in stocks is driven by company performance, investor sentiment, market perception, and structural sector trends, which distinguish it from commodity price movements[cite: 39]. By using a disciplined momentum investing framework with quantitative indicators like RSI and ROC, investors can objectively track price action to identify optimal entry and exit points[cite: 39]. This systematic approach eliminates emotional bias and minimizes downside risks during sudden trend reversals[cite: 39].
Definition: Momentum in stocks is an investing concept where equities exhibiting strong upward or downward price trends are expected to continue moving in the same direction over a short to medium-term horizon[cite: 39]. It relies purely on data-driven price action and technical indicators rather than underlying fundamental valuations or market narratives[cite: 39].
Key Takeaways
- Market movements fundamentally revolve around demand and supply dynamics across all asset classes, including stocks, commodities, bonds, and real estate[cite: 39].
- Momentum can be non-steady and driven by speculative hype or misconceptions, as seen when a company rallies simply because of an industry word in its name[cite: 39].
- Steady momentum exhibits sustained upward trajectories with predictable price phases that can be validated by quantitative indicators like Simple Moving Averages[cite: 39].
- Momentum investors focus entirely on price action and trend direction rather than analyzing the underlying corporate reasons behind the price movements[cite: 39].
- A complete momentum investing strategy relies on layered indicators like RSI and ROC to filter false signals and clearly define entry, holding, and exit rules[cite: 39].
Broader Overview of Momentum
Every investor follows a unique strategy when allocating capital across asset classes[cite: 39]. The investment horizon depends on the nature of the asset[cite: 39]. For example, during festivals like Diwali, gold demand surges, leading to a rise in price—this is a classic example of seasonal momentum driven by demand fluctuations[cite: 39]. Market movements fundamentally revolve around demand and supply dynamics[cite: 39].
Momentum as a concept is observed across all asset classes—stocks, commodities, bonds, and even real estate[cite: 39]. A notable example of momentum in commodities was during the COVID-19 crisis when gold and silver witnessed a sharp rally:[cite: 39]
- Gold surged from ₹38,000 per 10g in 2019 to ₹56,200 in August 2020 (+48%)[cite: 39].
- Silver jumped from ₹38,000 per kg in 2019 to ₹77,000 in August 2020 (+102%)[cite: 39].
This price momentum was fueled by investor panic and a shift to safe-haven assets amid economic uncertainty[cite: 39]. While monetary policies and macroeconomic factors played a role, the primary driver was market psychology and liquidity flows[cite: 39].
Momentum in Stocks: Beyond Demand & Supply
Momentum in stocks operates differently from commodities or bonds[cite: 39]. Unlike commodities, where prices are heavily influenced by external factors like inflation, interest rates, and supply-demand dynamics, stock prices are primarily driven by company performance, investor sentiment, and market perception[cite: 39]. Momentum in equities often extends beyond individual stocks, influencing entire sectors[cite: 39]. When a particular sector gains momentum, most stocks within that sector tend to rally[cite: 39]. This is driven by market narratives and FOMO (Fear of Missing Out), leading investors to chase trending opportunities[cite: 39].
Types of Momentum: Non-Steady vs. Steady
Understanding Non-Steady Momentum
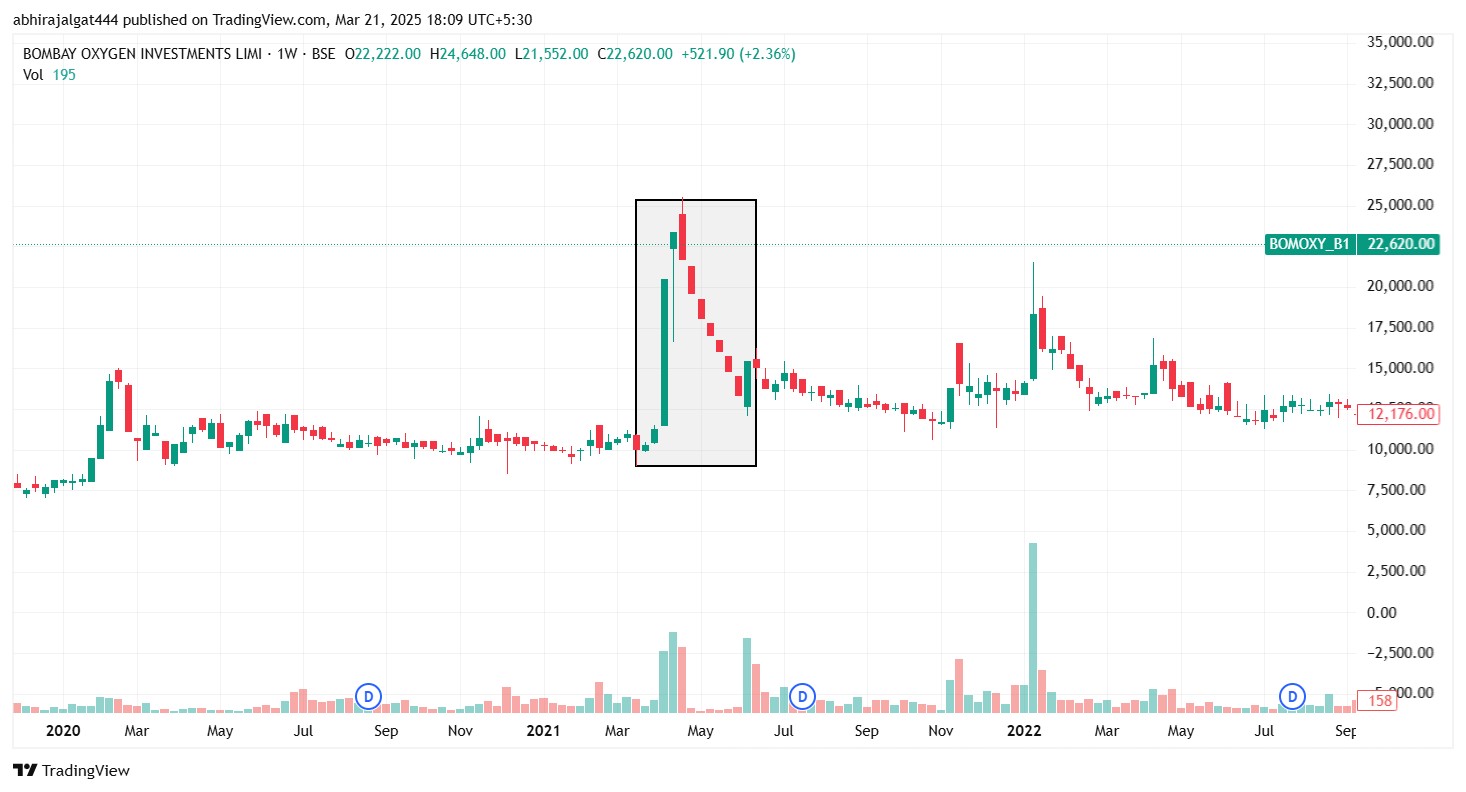
A classic example of non-steady momentum was the Oxygen Supply Rally during COVID-19[cite: 39]. As hospitals faced severe oxygen shortages, companies involved in oxygen supply and manufacturing saw their stock prices surge[cite: 39]. However, an interesting anomaly occurred—Bombay Oxygen Investments Ltd., a company that had nothing to do with oxygen production, experienced a sharp rally simply because the word "Oxygen" was in its name[cite: 39]. Many retail investors misinterpreted its business model, assuming it was part of the industry[cite: 39].
This example highlights how momentum can sometimes be driven by misconceptions and speculative hype, making it essential to have a structured framework that ensures well-informed entry and exit decisions rather than blindly chasing trends[cite: 39].
Recognizing Steady Momentum
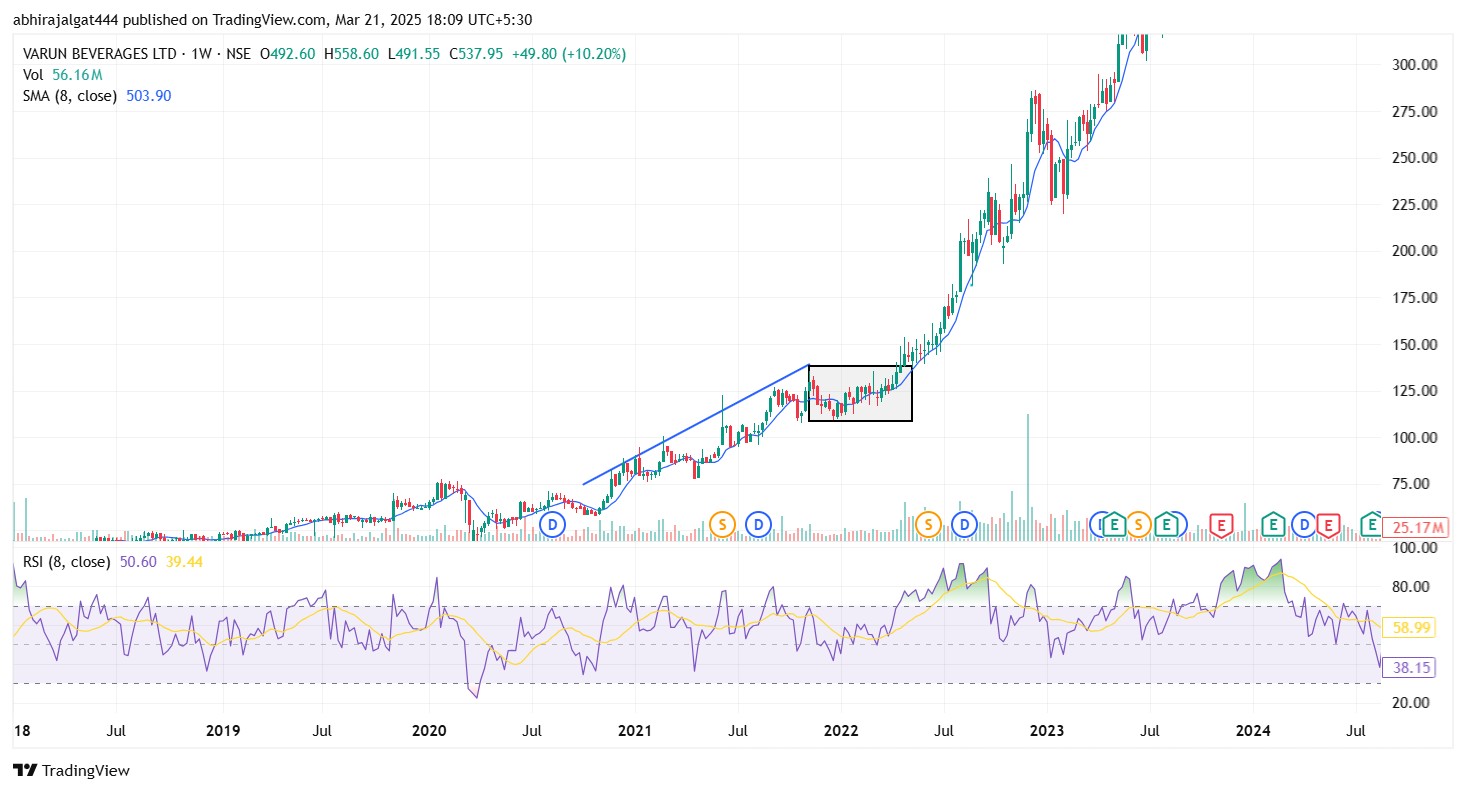
A contrasting example of steady momentum is Varun Beverages, where the stock exhibited a sustained upward trend from October 2020 to November 2021[cite: 39]. Over this period, even if an investor failed to recognize the initial momentum shift, a well-defined framework would have identified optimal entry points within the highlighted rectangular zone[cite: 39]. The stock maintained a steady upward trajectory, demonstrating a smoother and more predictable momentum phase[cite: 39].
Here, indicators such as Price above the Simple Moving Average (SMA) and RSI Strength above SMA provided confirmation signals, reducing investment guesswork[cite: 39]. Many such indicators help investors objectively track price movements instead of relying solely on intuition[cite: 39].
It’s important to remember that price patterns reflect investor perception—momentum can either work in your favor or against you[cite: 39]. This is where a structured momentum framework becomes essential—guiding investors through both entry and exit points while minimizing emotional biases[cite: 39].
Momentum Works Both Ways
Momentum isn’t just about rising prices—it also applies to declining trends[cite: 39].
Understanding Momentum Through Titan Company Ltd
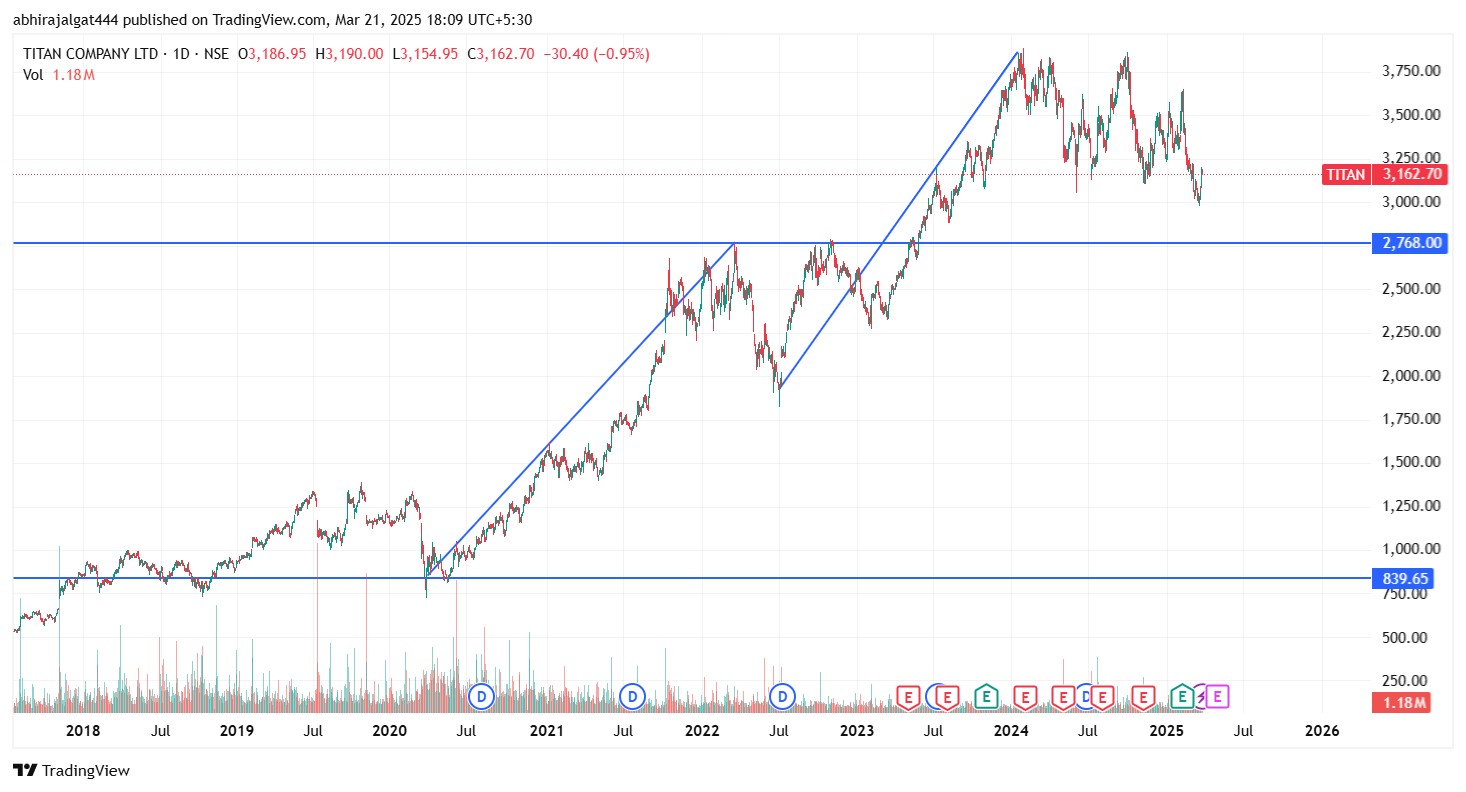
Looking at the chart, Titan's stock price surged from ₹850 to ₹2,700 within two years[cite: 39]. This significant price movement indicates that some force fueled the momentum, pushing the stock to new highs[cite: 39].
Investors use different strategies like Discounted Cash Flow (DCF), growth investing, or value investing to make decisions[cite: 39]. However, for a momentum investor, the reason behind the price rise is not the primary concern[cite: 39]. Momentum investors don’t focus on why the stock is moving or whether someone is taking a contrarian position—they simply follow the price action and trend[cite: 39].
The Momentum Investing Framework
This is where the Momentum Investing Framework comes into play[cite: 39]. It is a structured set of indicators and signals that help confirm whether a stock is currently in an upward momentum phase[cite: 39]. However, momentum is highly subjective—different investors use different frameworks based on their experience and strategy[cite: 39].
The stock market is dynamic, and even with a well-structured framework, losses can occur—especially if downward momentum is ignored[cite: 39]. Recognizing both positive and negative momentum is key to making informed investment decisions and managing risk effectively[cite: 39].
Momentum Indicators: The Key to Smart Investing
Momentum indicators act as alerts, helping investors determine whether market conditions align with their predefined framework[cite: 39]. These indicators help investors identify entry points, exit zones, and holding periods within a momentum strategy[cite: 39].
A well-structured momentum framework provides a complete strategy:[cite: 39]
- Entry – When conditions signal strong momentum[cite: 39].
- Hold – Staying invested while momentum remains intact[cite: 39].
- Exit – Exiting before momentum weakens significantly[cite: 39].
Even in a worst-case scenario, a strong framework ensures that investors minimize losses and avoid being trapped in unfavorable trends[cite: 39]. This structured approach differentiates momentum investing from random stock picking and helps navigate market cycles efficiently[cite: 39].
Example: Using RSI & ROC as a Momentum Indicator
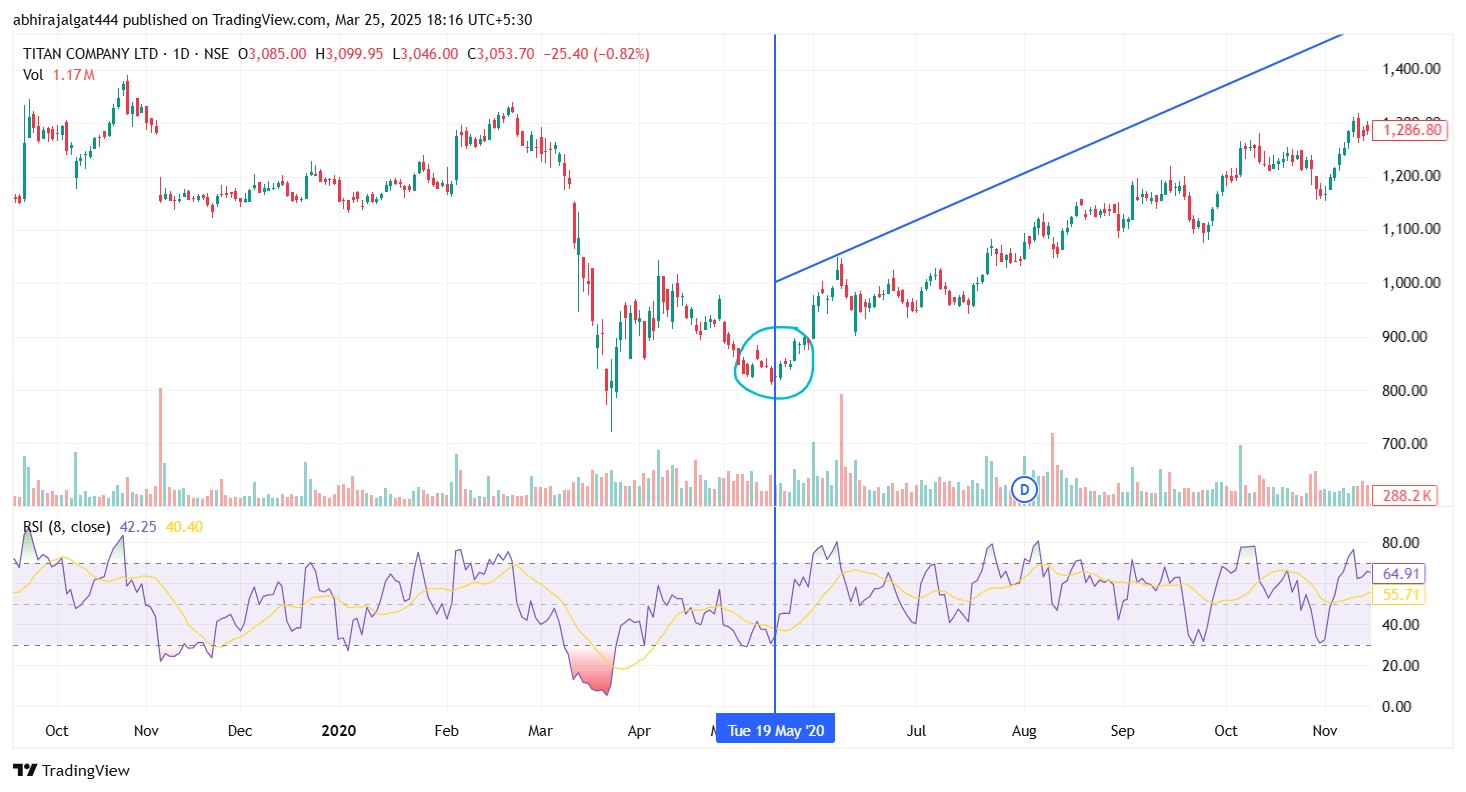
In the chart above, the violet line represents the Relative Strength Index (RSI) of the price, while the yellow line represents the 8-day Simple Moving Average (SMA) of the price[cite: 39].
Momentum Entry Rule:[cite: 39]
- If the violet line (price) is above the yellow line (SMA), it signals that the stock is trading above its 8-day average, indicating positive momentum—a potential buy signal[cite: 39].
- By adjusting the chart to a weekly or monthly timeframe, a clearer long-term momentum picture can be observed[cite: 39].
This is how momentum indicators help in identifying suitable entry and exit points, ensuring investments align with market trends instead of being purely speculative[cite: 39].
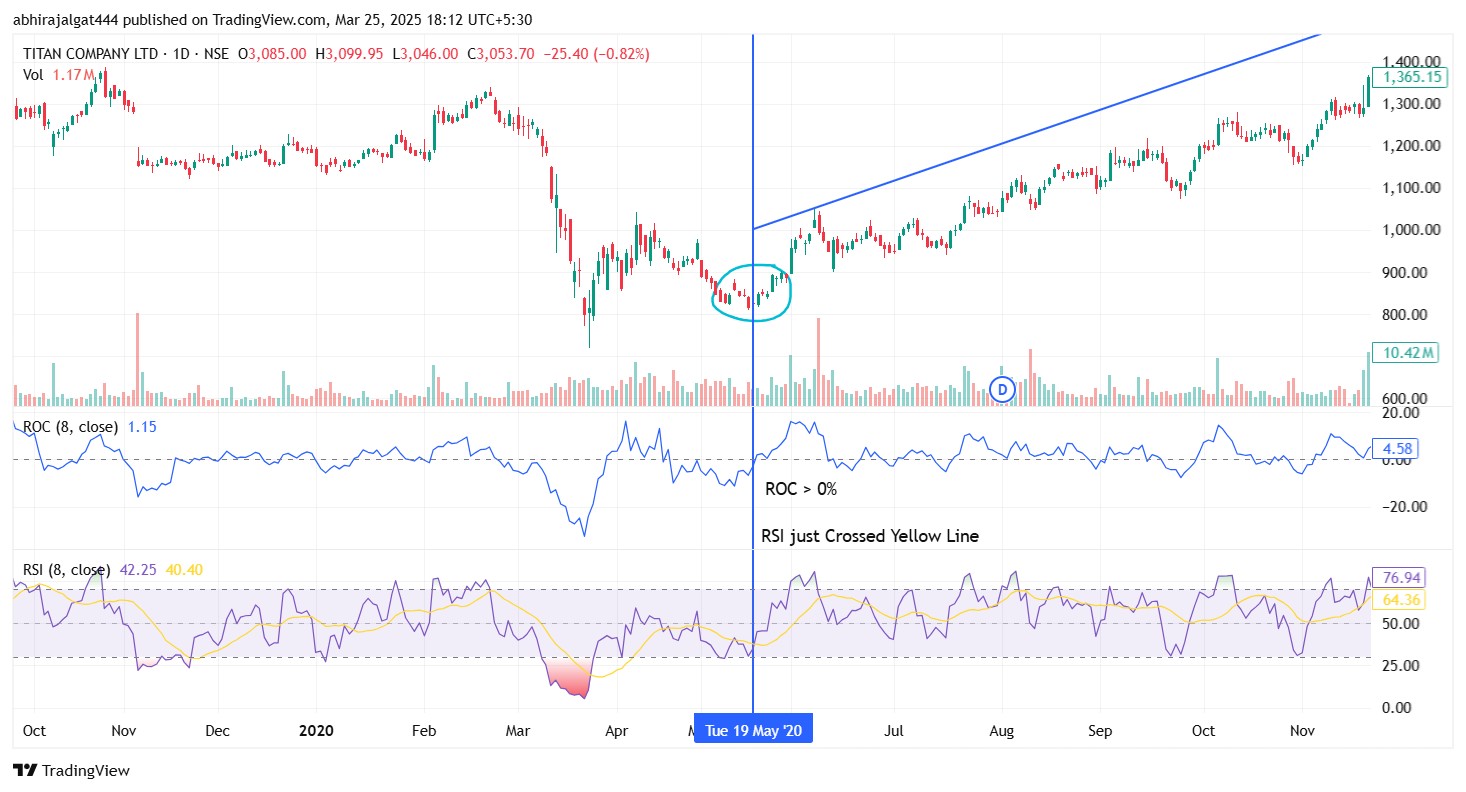
In the above chart, we observe that the Rate of Change (ROC) indicator has just crossed 0%, meaning that over the last 8 days, the stock has started showing positive price movement[cite: 39]. If our momentum framework considers entry signals when ROC turns positive (>0%), this point would be identified as a potential entry opportunity[cite: 39].
Moreover, when we analyze both RSI and ROC together, they provide a stronger confirmation for entry[cite: 39]. This layered approach helps filter out false signals, increasing the probability of identifying a stock in a true momentum phase[cite: 39].
Similarly, there are multiple ways through which an investor can confirm whether a stock is entering an upward momentum phase[cite: 39]. Indicators act as early signals, suggesting that a stock is likely to continue its upward rally sooner or later[cite: 39]. However, momentum investing doesn’t stop at just identifying entry points—our framework also defines exit strategies, ensuring that profits are protected and downside risks are minimized[cite: 39].
Entry & Exit in Momentum Investing
Identifying the right time to exit is just as important as identifying when to enter[cite: 39]. A well-defined momentum framework provides early signals, helping investors anticipate trend reversals before they happen[cite: 39].
Many investors rely on stop-loss levels, but momentum investing emphasizes identifying a gradual decline in momentum rather than reacting to a sudden price drop[cite: 39]. This structured approach enables investors to:[cite: 39]
- Exit partially by selling a portion of holdings[cite: 39].
- Exit fully when momentum weakens[cite: 39].
Momentum frameworks often provide early warnings about a market, sector, or stock entering a challenging phase[cite: 39]. These signals may not always be 100% accurate, but they serve as a risk management tool, helping investors minimize losses[cite: 39].
One key principle of momentum investing is that it focuses on price trends over fundamentals[cite: 39]. Even if a company has strong fundamentals, a stock may exit the momentum phase[cite: 39]. However, the same stock could re-enter the buy zone later, providing another investment opportunity when conditions align again[cite: 39].
What Makes Momentum Investing Unique?
Momentum investing is different from other strategies because it relies on a structured framework, not emotions or market narratives[cite: 39]. Here’s why it stands out:[cite: 39]
- Discipline & Consistency – Following a predefined framework prevents impulsive decisions[cite: 39].
- No Emotional Bias – Data and signals drive decisions, reducing fear or greed-based mistakes[cite: 39].
- Loss Minimization – Early trend reversal signals allow for timely exits, preventing major losses[cite: 39].
- Hassle-Free Approach – No need for constant monitoring of charts or financial reports[cite: 39].
- Independent of Market Sentiment – Whether markets are bullish, bearish, or volatile, your framework ensures objective decisions based on momentum trends[cite: 39].
By adopting a momentum-driven strategy, investors can eliminate guesswork, capitalize on trends, and maximize returns while managing risk effectively[cite: 39].
Final Thoughts
Momentum investing isn’t about predicting the future—it’s about reacting to market trends efficiently[cite: 39]. Whether upward or downward momentum, the key is to follow a structured framework, stay disciplined, and execute timely entries and exits[cite: 39].
By leveraging momentum indicators, investors can avoid speculation and invest based on trend confirmation rather than gut feelings[cite: 39]. In an ever-changing stock market, a well-defined momentum framework provides the edge needed to stay ahead[cite: 39].
Momentum isn't about luck—it's about strategy. Stay ahead, stay disciplined, and let momentum work in your favor![cite: 39]
BossInvestor is a SEBI Registered Research Analyst (INH000024143). Results shown are based on historical data and do not guarantee future performance[cite: 39].
Frequently Asked Questions
How can an Indian investor find momentum stocks using technical indicators?
Indian market participants utilize technical scanning platforms to filter equities trading on the National Stock Exchange (NSE) or Bombay Stock Exchange (BSE)[cite: 39]. Common criteria include scanning for stocks where the daily closing price has crossed above the 200-day or 50-day Simple Moving Average (SMA), alongside an RSI value exceeding 60[cite: 39]. Combining these filters with a positive Rate of Change (ROC) indicates structural acceleration[cite: 39]. This process creates a clean watchlist of active breakout candidates across diverse sectors[cite: 39].
What is the difference between momentum investing and value investing in India?
Value investing concentrates on identifying corporate mispricings relative to underlying fundamentals, financial statements, and discounted cash flows, often requiring long holding periods for price correction[cite: 39]. Momentum investing focuses exclusively on rapid price trends and velocity, bypassing the intrinsic value calculations entirely[cite: 39]. A momentum strategy seeks to purchase stocks that exhibit strong relative strength, expecting high demand to continue propelling the price upward regardless of the traditional valuation multiples[cite: 39].
How do macroeconomic shifts affect stock price velocity across different sectors?
Macroeconomic structural adjustments, such as alterations in interest rates by the Reserve Bank of India or shifting liquidity conditions, directly impact capital reallocation[cite: 39]. When liquidity enters specific sectors, it creates robust sectoral momentum, causing multiple associated equities to rally together due to capital flows[cite: 39]. Conversely, macroeconomic tightening can stifle price acceleration, highlighting the necessity of data-driven tracking mechanisms over individual corporate projections during broad market cycles[cite: 39].
Why is a strict exit rule necessary when executing a relative strength strategy?
Because price velocity can experience rapid reversal shifts, relying purely on corporate fundamentals during a downturn can lead to substantial drawdowns[cite: 39]. A systematic strategy relies heavily on technical signals like moving average breakdowns or dropping momentum oscillators to signal systematic exit windows[cite: 39]. Implementing these rules protects accumulated capital, prevents retail participants from remaining trapped in speculative bubbles, and manages absolute downside exposure effectively[cite: 39].
Can false technical breakouts be mitigated when identifying structural trends?
False signals are a frequent reality in active markets, but combining complementary technical indicators significantly lowers the probability of bad entries[cite: 39]. Layering a trend indicator like the Simple Moving Average alongside a momentum oscillator like the Rate of Change ensures both trend direction and price velocity confirm the move simultaneously[cite: 39]. This quantitative combination provides robust cross-verification, filtering out transient spikes and ensuring capital is deployed strictly into confirmed cyclical movements[cite: 39].
Related Blogs

Biocon Shares Jump 6% on Volume Breakout & Biosimilars Growth
Published: Thu Jul 16 2026Read more…

SBI Funds Management IPO Closes: ₹11,693 Cr Issue Sets Record
Published: Thu Jul 16 2026Read more…

Alok Industries Q1 FY27 Results Board Meeting Today
Published: Thu Jul 16 2026Read more…

ITC Hotels Slips 5% Despite 36% Jump in Q1 Net Profit
Published: Fri Jul 17 2026Read more…