How to Analyse a Stock Before Buying: A 10-Point Checklist
"How do I analyse a stock?" has an honest answer: run the same checklist on every company, so you judge them all by one standard instead of a story. Here are the 10 checks that matter — what each one measures, how to read it, and the whole-market data showing how few stocks actually pass.

BOSSINVESTOR
Sun Sep 07 2026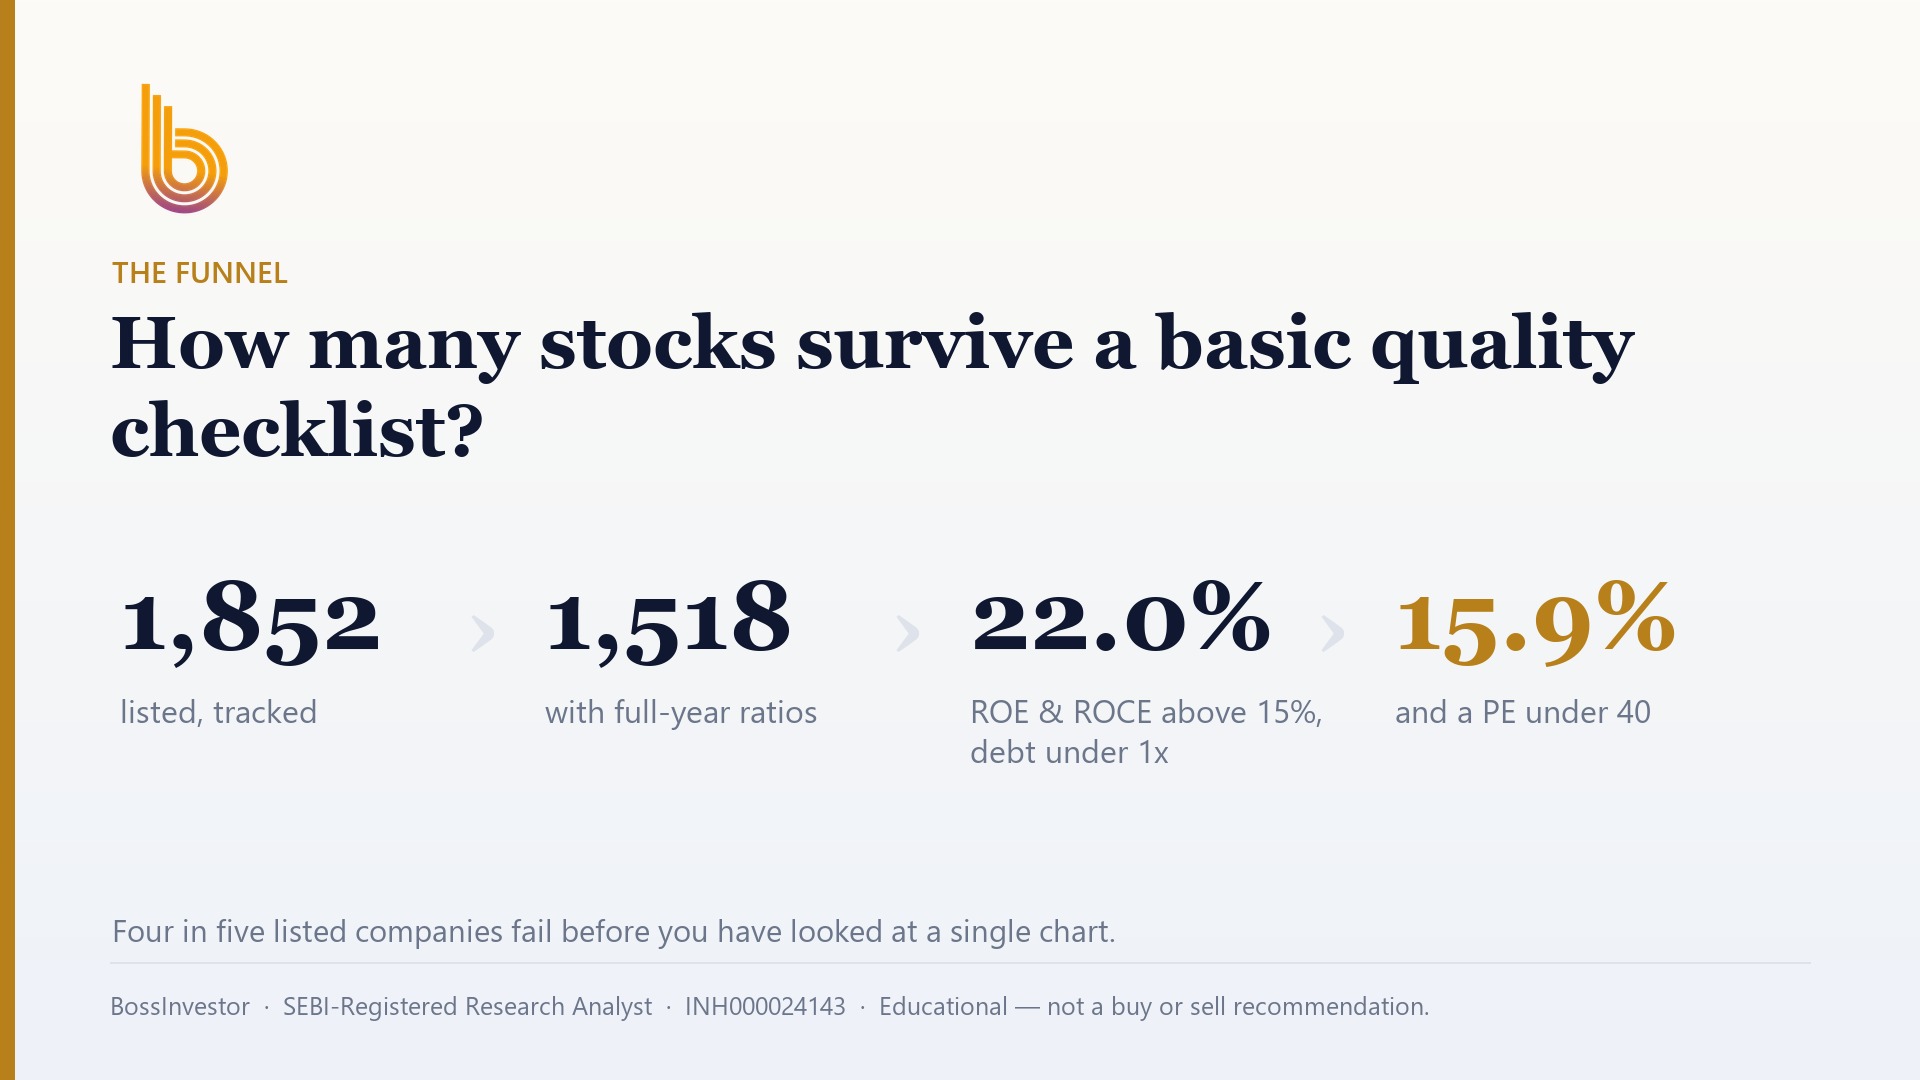
How Do You Analyse a Stock Before Buying?
To analyse a stock before buying, run every company through the same fixed checklist so you judge it by a standard, not a story: (1) understand the business, (2) check revenue and profit growth, (3) test profitability with ROE and ROCE, (4) examine debt and the balance sheet, (5) confirm profit converts to cash flow, (6) read the margin trend, (7) judge the valuation (PE, PEG, P/B), (8) check promoter holding and pledging, (9) assess the moat and management, and (10) rank the company within its sector. A stock is worth buying only when it clears the checklist and its price is reasonable for that quality. The discipline is in applying all ten every time — most stocks fail early, and that is the point.
Key Takeaways
- Analysis is a repeatable checklist, not a hunch — the value is in judging every stock the same way.
- Growth tells you the business is expanding; ROE and ROCE tell you whether that growth is profitable.
- Debt, cash flow and margins are the risk checks — they catch problems a rising share price hides.
- Valuation comes last: a great business at a silly price is still a bad buy.
- As of August 2026, only about 22% of listed Indian stocks cleared a basic quality bar (ROE >15%, ROCE >15%, debt-to-equity <1); adding a simple valuation check left just ~16%.
- Every check is sector-relative — a "good" number in one industry is mediocre in another.
Why Use a Checklist at All?
Most buying decisions go wrong before a single number is checked. A tip, a chart that "looks strong", a name in the news — and the position is on. A checklist removes that. When you run the identical set of questions on every company, you stop being persuaded by the story around a stock and start comparing businesses on the same terms. It also makes you honest: a company you like will fail some checks, and a company you had never heard of will pass them. The ten checks below move from the business itself, to how well it earns, to how safe it is, to what you are being asked to pay.
The 10-Point Stock Analysis Checklist
1. Understand the business — what does it actually sell?
Before any ratio, answer in one plain sentence: how does this company make money, and who pays it? What are its products, its customers, its competitors, and what could stop it earning three years from now? If you cannot explain the business simply, you cannot judge whether its numbers are good or its price is fair. This is the foundation every later check rests on.
2. Revenue and profit growth — is the business getting bigger?
Look at the last five years of revenue (sales) and net profit. You want to see both rising, and ideally profit growing at least as fast as revenue — that means the company is becoming more efficient as it scales, not just bigger. Read the trend, not one year: a single strong quarter can be a one-off, while five years of steady growth is a pattern. Beware revenue rising while profit stalls — that is a business buying growth it cannot convert into earnings.
3. Profitability and returns — ROE and ROCE
Growth only matters if it is profitable. Two ratios tell you that. Return on Equity (ROE) measures the return generated on shareholders' money; Return on Capital Employed (ROCE) measures the return on all the capital in the business, equity and debt together. A durable, high-quality business earns well above its cost of capital on both, consistently. As a rough guide, ROE and ROCE above 15% are good and above 20% strong — but always sector-relative, and always read across five years rather than one. For a fuller treatment, see our guide on the fundamental factor in investing.
4. Debt and the balance sheet — can it survive a bad year?
Profit is opinion until the balance sheet backs it. Check debt-to-equity (D/E) — how much the company owes relative to its own capital — and interest coverage — how many times its operating profit covers its interest bill. Lower debt and higher coverage mean the business can survive a downturn without being forced into bad decisions. A D/E below 1 is comfortable for most non-financial companies; banks and NBFCs are a special case, because borrowing is their business model, so they must be judged on different measures. High debt does not automatically disqualify a company, but it raises the bar every other check has to clear.
5. Cash flow — does the profit turn into real money?
A company can report profit and still run out of cash. The check: does operating cash flow broadly track net profit over time? If reported profits are consistently far higher than the cash actually coming in, ask why — it can be aggressive accounting, money stuck in unpaid receivables, or inventory piling up. Cash flow is the reality check on the profit-and-loss statement, and it is one of the hardest numbers to dress up.
6. Margins and their trend — does it have pricing power?
Operating margin (operating profit as a share of sales) shows how much of every rupee of revenue the company keeps before financing and tax. The level matters, but the trend matters more: expanding margins signal pricing power or improving efficiency; steadily shrinking margins signal competition eating the business alive. Compare the margin to sector peers — a 12% margin can be excellent in a thin-margin industry and poor in a premium one.
7. Valuation — is the price sane?
Only now do you look at price. The price-to-earnings (PE) ratio tells you how many years of current earnings you are paying for; the PEG ratio puts that PE in the context of growth; the price-to-book (P/B) ratio matters most for asset-heavy and financial businesses. There is no universal "cheap" number — a fast-growing, high-quality company deserves a higher PE than a slow one. The question is not "is the PE low?" but "is this price reasonable for this quality and this growth?" A wonderful business bought at a reckless price is still a poor investment.
8. Promoter holding and pledging — is the owner aligned with you?
Read the shareholding pattern. A high and stable promoter holding usually means the people running the company have their own wealth riding on it alongside yours. Two things to watch: promoters steadily selling their stake, and shares pledged as collateral for loans — a high pledge is a red flag, because a falling price can force sales that cascade. This is a governance check, and it can override otherwise good numbers.
9. Moat and management — will the returns last?
High ROCE attracts competition. What stops rivals from competing it away? A durable advantage — a moat — can be a strong brand, a cost advantage, a network effect, switching costs, or regulatory position. Alongside it, judge management: their track record on capital allocation, the honesty of their communication, and whether past promises matched results. Numbers are the scoreboard; the moat and management are what keep the score high in future years.
10. Sector context and rank — good compared to what?
Every number above is only meaningful relative to peers. The final check is to place the company inside its sector: is its ROCE top-decile or middling for that industry? Are its margins and growth ahead of or behind its direct competitors? Is the whole sector in favour or out of it? A middling company in a strong sector and a strong company in a dying sector are very different propositions. Ranking within the peer group turns ten standalone numbers into a single, comparable judgement.
What the Whole Market Looks Like Through This Checklist
Here is why the checklist matters: run even a basic version of it across the whole market and most stocks fall out immediately. Using BossInvestor's full-year fundamentals for the listed Indian universe as of August 2026 (1,518 companies with complete data), a simple quality bar — ROE above 15%, ROCE above 15%, and debt-to-equity below 1, all at once — is cleared by only about 22% of stocks (334 names). Add a single valuation sanity check, a price-to-earnings ratio under 40, and the field narrows to roughly 16% — about 241 stocks.
| Basic check (Aug 2026, 1,518 listed stocks) | Stocks passing | Share |
|---|---|---|
| ROE above 15% | 458 | 30% |
| ROCE above 15% | 464 | 31% |
| Debt-to-equity below 1 | 1,282 | 85% |
| PE between 0 and 40 | 988 | 65% |
| Quality: ROE >15% AND ROCE >15% AND D/E <1 | 334 | 22% |
| Quality + valuation (+ PE under 40) | 241 | 16% |
More than four in five listed stocks fail a basic checklist before you have looked at a chart, read a single annual report, or thought about a moat. That is not a reason for despair — it is the whole job. Analysis is a filter: its purpose is to throw away the many so you can spend your limited time on the few that are worth deep work. (These figures are an illustrative screen, not a buy list — financials, for instance, are penalised unfairly by a flat debt rule, which is exactly why the real work is sector-relative.)
This is precisely the computation BossInvestor runs across nearly 1,900 stocks — building the ROE, ROCE, debt, margin and valuation picture, ranking each company within its sector, and surfacing the shortlist that passes — so you start from the 241, not the 1,518.
Click Here – See BossInvestor's Data-Driven Stock Screens
Conclusion
"How to analyse a stock before buying" is not a secret formula — it is a discipline. Understand the business, confirm it is growing, check that the growth is profitable through ROE and ROCE, make sure the balance sheet and cash flow are sound, read the margin trend, judge the valuation, check that the owner is aligned, ask whether the advantage will last, and rank it all within the sector. Run that checklist the same way every time and two things happen: most stocks fail fast, and the ones that survive have earned a closer look. The market gives you nearly 1,900 choices; the checklist is how you turn that into a handful worth your money.
BossInvestor is a SEBI Registered Research Analyst (INH000024143). This article is for educational and informational purposes only. It explains a method for analysing stocks and is not investment advice, nor a recommendation to buy, sell or hold any security. The market-wide figures are an illustrative screen based on historical data as of August 2026; they name no stock as a recommendation, and past metrics do not guarantee future results. Always do your own research or consult a registered adviser before investing.
Frequently Asked Questions
How do you analyse a stock before buying it?
Work through a fixed checklist so you judge every stock the same way: understand the business, check revenue and profit growth, test profitability with ROE and ROCE, examine the debt and balance sheet, confirm profit converts to cash flow, read the margin trend, judge the valuation (PE, PEG, P/B), check promoter holding and pledging, assess the moat and management, and rank the company within its sector. A stock is only worth buying when it clears the checklist and its price is reasonable relative to that quality.
What financial ratios should you check before buying a stock?
The core set is: ROE and ROCE for profitability and capital efficiency, debt-to-equity and interest coverage for balance-sheet risk, the PE, PEG and price-to-book ratios for valuation, and operating and net margins for pricing power. No single ratio decides anything on its own — each must be read against the company's own history and its sector peers.
How many stocks actually pass a basic quality checklist?
Very few. As of August 2026, across roughly 1,500 listed Indian companies with full-year fundamentals, only about 22% cleared a basic quality bar of ROE above 15%, ROCE above 15% and debt-to-equity below 1 at the same time. Adding a simple valuation check (a PE under 40) narrowed the list to about 16%. More than four in five stocks fail a basic checklist before you have even looked at a chart.
Is fundamental analysis enough, or do you also need technical analysis?
Fundamental analysis tells you whether a business is worth owning; technical analysis and price behaviour help with timing an entry. Most long-term investors lead with fundamentals to decide what to buy, then use simple price context — such as trend and relative strength within the sector — to decide when. The checklist in this article is the fundamental half; timing is a separate step.
How long does it take to analyse one stock properly?
A disciplined first pass on a single company — reading the business, the last few years of financials, the balance sheet, cash flow and valuation, and comparing it to sector peers — typically takes a few hours. Doing that consistently across a universe of nearly 1,900 stocks every quarter is what screening tools and platforms like BossInvestor automate, so you spend your time on the shortlist rather than the search.
Related Blogs

The Fundamental Factor in Investing
Published: Thu Mar 27 2025Read more…
Decoding Consistent Compounders
Published: Fri Mar 28 2025Read more…

Importance Of Growth Factor
Published: Fri Mar 28 2025Read more…
Does the 52-Week High Matter? A Look at Backtesting Results
Published: Wed Apr 09 2025Read more…