How do you backtest a trading strategy?
This page walks you through backtesting the way a careful person would do it, not the way a course sells it. You will learn how to write your rules down, where to get data, what costs to subtract, and the three mistakes that make almost every backtest look better than reality.

BOSSINVESTOR
Mon Sep 07 2026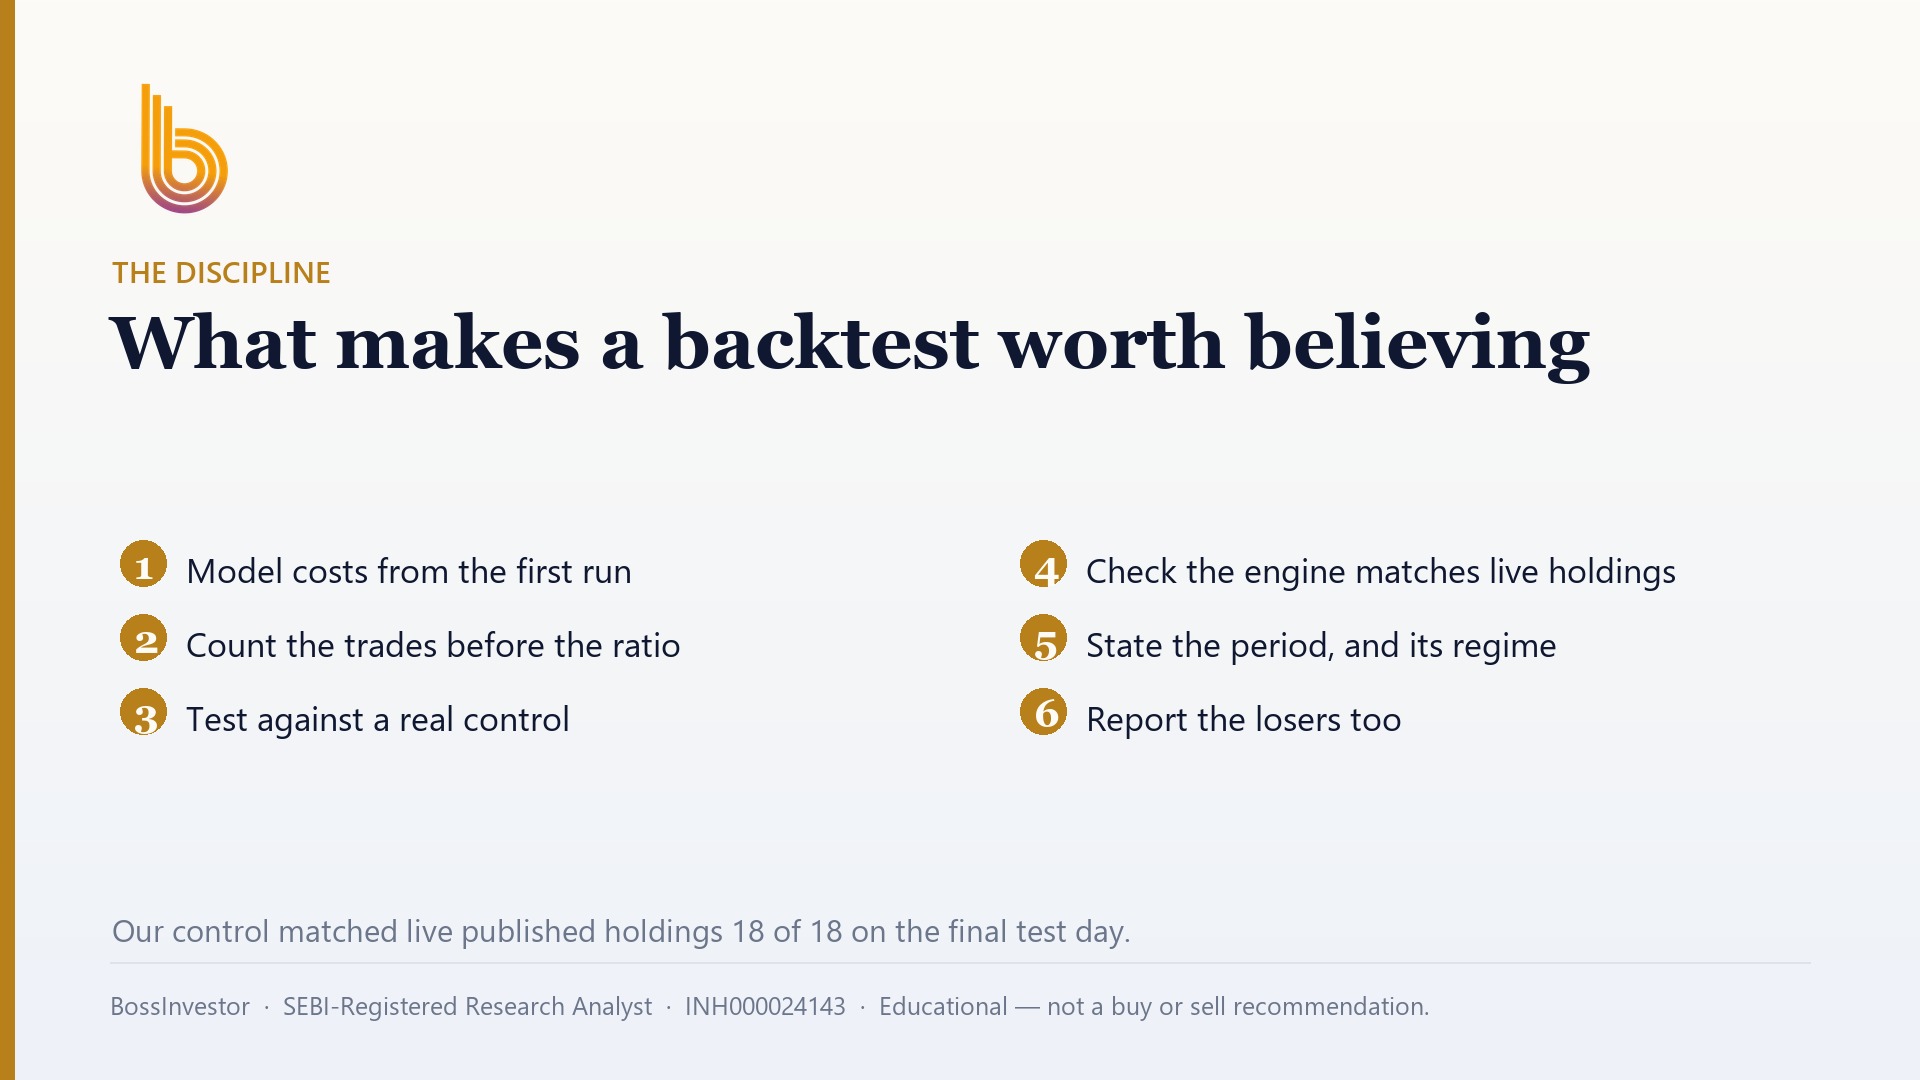
What is the step-by-step way to test a trading strategy on past Indian market data?
Backtesting means running your exact buy and sell rules over past NSE or BSE data to see what they would have earned. Write the rules down, pick at least ten years of data including a crash, subtract brokerage, STT and taxes, then check the worst loss you would have had to sit through.
Key Takeaways
- A backtest is only as honest as the rules you wrote down before you looked at the chart.
- Ten years minimum, and the period must include at least one crash and one boring sideways year.
- Costs and taxes are not a footnote in India, they are often the whole difference between profit and loss.
- If your list of stocks does not include the ones that got delisted, your result is fake.
- As of August 2026, only 22.0% of the 1,518 Indian companies with full-year fundamentals clear a basic quality bar, so a strategy that assumes a large pool is already wrong.
- The number that decides whether you can actually follow the strategy is the worst fall, not the return.
What does backtesting a trading strategy actually mean?
Backtesting is a rehearsal. You take a set of rules, you run them over market data from the past, and you see what would have happened if you had followed those rules without ever changing your mind. That last part is the whole point. In real life you skip trades, you hold losers, you double down after a bad week. A backtest strips all of that away and shows you what the rules alone produce.
It is not a prediction. Nobody can promise that what worked from 2015 to 2025 will work from 2026 onward. What a backtest actually gives you is something more useful and less exciting: it tells you whether your idea has ever worked, how often it lost, and how bad the bad stretches were. Most strategies fail this test. That is a good outcome. It costs you a weekend instead of two lakh rupees.
Think of it as a medical test before surgery, not a horoscope. You are checking for reasons not to proceed.
What do I need before I can start a backtest?
Four things. First, a written rule set with no gaps. Second, price data for Indian stocks or indices going back far enough. Third, a way to run the rules over that data, which can be a spreadsheet if your strategy is simple. Fourth, and people forget this one, a written note of what result would make you reject the idea. Decide that before you see the answer.
You do not need Python on day one. A monthly rebalanced strategy on twenty stocks can be tested in Excel or Google Sheets with a few thousand rows. If your strategy trades intraday or uses tick data, you will need code and a proper data feed, and you should be honest that this is a bigger project than a weekend.
What you also need is patience with your own idea. The first backtest almost never works. The temptation at that moment is to tweak one number until it does. Resist it, or at least write down every tweak you make, because that list is the real record of how much you have fooled yourself.
How do I write down my rules so there is nothing left to guess?
Every rule has to be answerable by a machine with no judgement. Bad rule: buy strong companies at reasonable valuations. Good rule: on the first trading day of each quarter, from the NSE 500, pick companies with return on equity above 15%, return on capital employed above 15% and debt-to-equity below 1, then keep the twenty with the lowest price-to-earnings ratio, equal weight, hold three months.
Notice what that version specifies: the universe, the date, the filters, the ranking, the position size, and the exit. You also need to state where the fundamental numbers come from and how stale they are allowed to be. A company reports its March results in May. If your backtest uses March data on 1 April, you are trading on information nobody had. That single error can flatter a result badly.
Also write your exit before your entry. Most people can describe when they buy and go vague when asked when they sell. If your rules do not say when you get out, you do not have a strategy, you have a hunch with a spreadsheet attached.
Where do I get clean Indian market data for a backtest?
NSE and BSE publish daily bhavcopy files going back years, free. Those give you open, high, low, close and volume for every listed scrip. For index levels and adjusted prices you can use the exchange archives or a paid data vendor. Broker APIs from the large Indian discount brokers give historical candles, usually a few years deep, which is enough for testing a short-term strategy but not for a long-term one.
Two data problems will bite you. The first is corporate actions. If a stock splits five for one, the raw price falls 80% overnight and your backtest will record a catastrophic loss that never happened. You need prices adjusted for splits, bonuses and dividends, or you need to apply the adjustments yourself.
The second is that fundamental data is much harder to get historically than price data. Screeners show you today's return on equity, not what it was in 2019. If you cannot source past fundamentals honestly, test a price-based strategy instead, or accept that your fundamental backtest is a rough sketch and size your money accordingly.
How do I actually run the backtest step by step?
Start on your first test date and move forward one period at a time, never looking at any data dated after that day. That single discipline is what separates a backtest from a fantasy. On each date, apply your filter, rank the survivors, pick your positions, and record the price you would realistically have paid. Use the next day's opening price, not the closing price of the signal day, because you cannot buy at a price you only learned about after the close.
Track a running portfolio value in rupees, not just a list of trades. Start with a realistic amount. Someone with two lakh rupees cannot hold thirty stocks in meaningful size, and pretending otherwise hides a real constraint.
Here is an illustrative example, with made-up figures purely to show the arithmetic: a quarterly strategy on a five lakh rupee portfolio, twenty stocks, four rebalances a year, replacing six stocks each time. That is roughly forty-eight round trips a year. At an assumed all-in cost of half a percent per round trip on the traded value, the churn alone eats a meaningful slice of the yearly return before the strategy has proved anything. Run those numbers for your own turnover before you fall in love with the idea.
What costs and taxes must I subtract from my backtest results?
In India the gap between gross and net is wide, and it is the single most common reason a beautiful backtest turns into a losing account. You must subtract brokerage, securities transaction tax, exchange transaction charges, GST on the brokerage and charges, stamp duty on the buy side, and the SEBI turnover fee. Pull an actual contract note from your broker, find the total charges on a real trade, divide by the trade value, and use that percentage in your model. Do not guess.
Then there is slippage, which is not on any contract note. It is the gap between the price you assumed and the price you got. For a Nifty 50 name it is small. For a smallcap that trades a few lakh rupees a day, it can be far larger than every statutory charge combined, and if your backtest assumes you bought ten lakh rupees of it at the opening price, the backtest is fiction.
Finally, tax. Short-term gains in India are taxed at a materially higher rate than long-term gains, and long-term gains get a small annual exemption. A strategy that flips positions every month is choosing the expensive tax treatment every single time. Model that, at current rates, on the trading pattern your rules actually produce.
How do I know if my backtest is lying to me?
Three lies show up again and again. The first is survivorship bias: you tested on today's Nifty 500, which by definition excludes every company that collapsed, got delisted or was thrown out of the index. Your backtest quietly avoided every disaster. Build your universe as it stood on each historical date, not as it stands now.
The second is look-ahead bias, which we covered above: using any number that was not public on the day you traded. Results, index changes and even adjusted prices can leak future information into a past date.
The third is over-fitting, and it is the most seductive. If you try eighty combinations of moving averages and keep the one that worked, you have not found a strategy, you have found the luckiest number in a table of random ones. The tell is fragility. Change your threshold slightly, from a 50-day average to a 45-day one, or your quality cut-off from 15% to 14%. If the result collapses, the strategy was noise. A real edge is blunt and survives small changes.
One more sanity check specific to India: check how many stocks your filter actually leaves. As of August 2026, of the 1,518 listed Indian companies with full-year fundamentals, only 22.0% clear all three of return on equity above 15%, return on capital employed above 15%, and debt-to-equity below 1 at once. Add a valuation check of price-to-earnings under 40 and 15.9% remain. If your rules leave you two stocks in 2013 and ninety in 2021, your portfolio was never the size you assumed. One caveat: a flat debt-to-equity rule unfairly punishes banks and NBFCs, because borrowing is their business, so exclude them from that particular filter or judge them separately.
What numbers should I look at once the backtest is finished?
Look at the worst fall first. Find the biggest drop from a portfolio peak to the following trough, in rupees and in percent, and find how many months it took to get back to the old high. That is the number that decides whether you can actually follow this strategy. A method that returns handsomely on paper but demands you sit through a 45% fall for two years will be abandoned by most people at the bottom, which converts a paper gain into a real loss.
Then look at the return, and compare it against simply holding a Nifty 50 index fund over the exact same dates, after the same costs. Plenty of strategies beat cash and lose to the index. If yours is one of them, you have built an expensive, stressful way to underperform a fund that charges a fraction of a percent.
Then look at consistency. Break the results into calendar years. A strategy that made everything in 2021 and nothing in the other nine years is not a strategy, it is one lucky bull market. And check the median price-to-earnings ratio of what you are buying against the market's own median, which stood at 24.0 as of August 2026, so you know whether your edge is quality or simply paying up.
How do I move from a passing backtest to real money?
Do not go from spreadsheet to full position size. Paper trade the rules forward for one or two full cycles, recording your intended trades in advance and comparing them to what you would actually have got. This forward test is worth more than another year of backtesting, because it catches the practical problems: a stock hitting its circuit limit, an order that does not fill, a rebalance date that falls on a holiday.
Then start with a small slice of capital, perhaps a tenth of what you eventually intend, and run it for a few quarters. Keep a log of every deviation from the rules, because the deviations are the real risk. Most strategies do not fail in the market, they fail in the moment the person running them decides to be clever.
And keep the rules written down somewhere you will read them when you are frightened. That document, not the returns column, is what a backtest is really for.
Click Here – See BossInvestor's Data-Driven Stock Screens
Conclusion
Backtesting is not a way to find a winning strategy. It is a way to reject bad ones cheaply, before they cost you real rupees. Write the rules so a machine could follow them, use data as it existed on each historical date, subtract every charge on your contract note plus the tax your churn triggers, and judge the result by the worst fall rather than the headline return. If you would rather see the screening work already done on a live Indian universe, that sits behind KYC in our app.
BossInvestor is a SEBI Registered Research Analyst (INH000024143). This article is for educational and informational purposes only. It explains a method and is not investment advice, nor a recommendation to buy, sell or hold any security. Market-wide figures are computed from our universe as of August 2026; past metrics do not guarantee future results. Always do your own research or consult a registered adviser before investing.
Frequently Asked Questions
How many years of data do I need for a reliable backtest?
Ten years is a sensible floor for a positional or investing strategy, and the window must include at least one severe fall and one dull sideways stretch. A test that runs only from 2020 to 2024 covers a period when almost everything went up, so it proves nothing about your rules. For intraday strategies, judge by number of trades rather than years, and be suspicious of any conclusion drawn from fewer than a few hundred of them.
Can I backtest a strategy in Excel or do I need Python?
Excel or Google Sheets is genuinely enough for monthly or quarterly strategies on a few dozen stocks. Download the NSE bhavcopy files, adjust for splits and bonuses, and step forward one period per row. You will need code once you move to daily signals across hundreds of stocks, or to intraday data, because the row count becomes unmanageable. Start in a spreadsheet. If the idea does not survive that, it will not survive Python either.
Why does my backtest look great but lose money in real trading?
Usually one of four reasons. You tested on today's index members, so every failed company was silently excluded. You used information that was not public on the trade date. You tuned parameters until the past looked good. Or you underestimated costs, which in India means brokerage, securities transaction tax, stamp duty, GST, exchange charges, slippage in illiquid names, and short-term capital gains tax on frequent trades. Check all four before blaming the market.
Does a good backtest mean the strategy will work in future?
No. A backtest tells you what your rules did in conditions that already happened, and markets change: liquidity shifts, sector leadership rotates, tax and regulation move. A passing backtest is permission to test forward with small money, not permission to commit your savings. Treat it as evidence that the idea is not obviously broken. The strategies that survive are usually the simple ones with few parameters, because there is less to break when conditions change.
How many stocks in India actually pass a basic quality filter?
Fewer than most people expect, which matters because it caps how diversified your backtested portfolio could ever have been. As of August 2026, of 1,518 listed Indian companies with full-year fundamentals, 22.0% clear return on equity above 15%, return on capital employed above 15% and debt-to-equity below 1 simultaneously, and 15.9% also pass a price-to-earnings under 40 check. Note that the flat debt rule unfairly penalises banks and NBFCs, since borrowing is their business model.
Related Blogs
How to Analyse a Stock Before Buying: A 10-Point Checklist
Published: Mon Sep 07 2026Read more…

How to Calculate Your Financial Freedom Number and Achieve It
Published: Tue May 20 2025Read more…
 (1).jpg)
From Signal to Strategy: The Moving Averages
Published: Tue May 20 2025Read more…

Market Share: The Silent Signal of Competitive Power and Investment Opportunity
Published: Wed May 14 2025Read more…