How to find undervalued stocks in India
This page walks you through the whole method, step by step, in plain language. You will learn which numbers to screen on, how to separate a genuinely cheap stock from a broken one, and how to put a rough rupee value on a business before you look at its price.

BOSSINVESTOR
Mon Sep 07 2026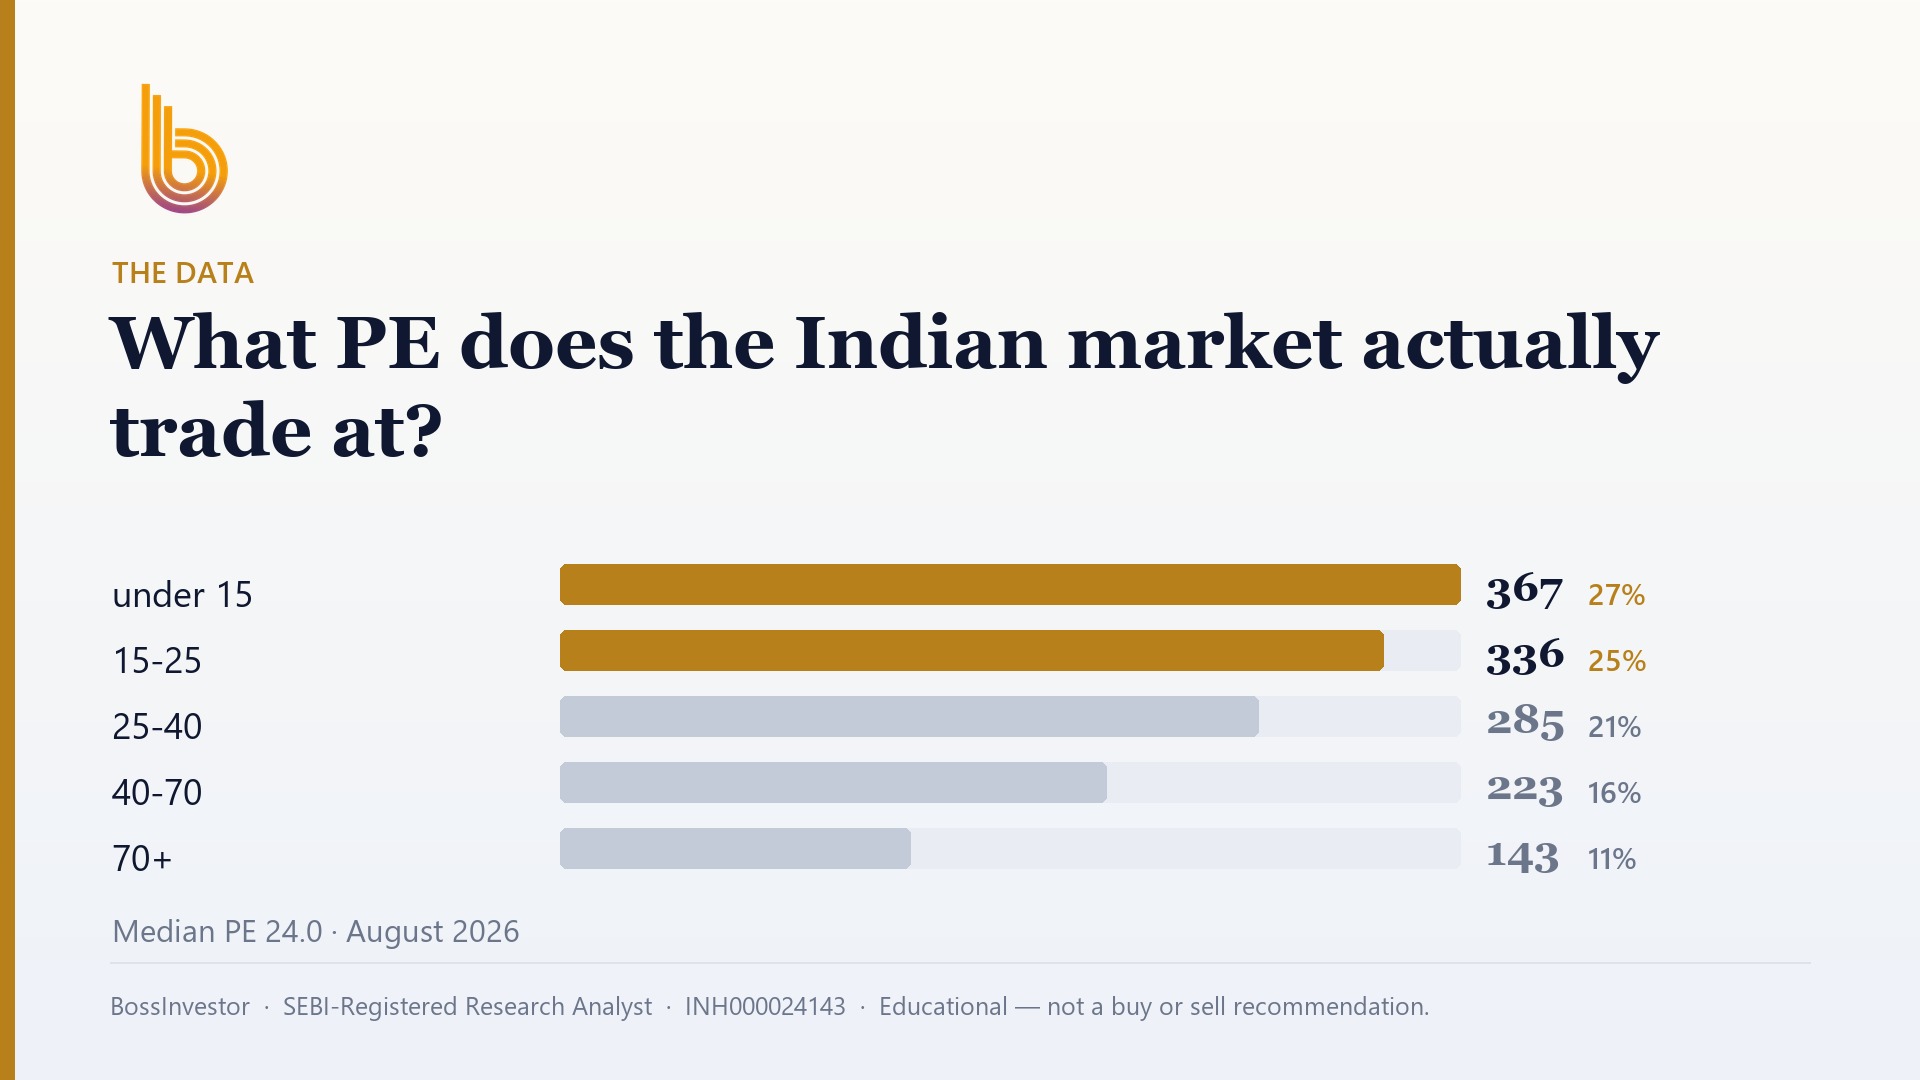
What is the simplest way to spot an undervalued Indian stock?
Finding undervalued stocks in India means comparing a company's price to what its business earns and owns. Screen NSE and BSE listings for high ROE, high ROCE, low debt and a sensible PE, then read the annual report to confirm the earnings are real and repeatable. Cheapness alone is not value — a low price with shrinking profits is a trap.
Key Takeaways
- A low share price is not the same thing as a cheap business.
- Filter for quality first, then for price. Never the other way round.
- As of August 2026, only 22.0% of the 1,518 Indian companies with full-year fundamentals in our universe clear a basic quality bar.
- Add a valuation check and just 15.9% survive — good, cheap companies are genuinely rare.
- Match profit against operating cash flow over five years. That one check kills most value traps.
- Buy meaningfully below your own estimate of fair value, so being slightly wrong still leaves you whole.
What does 'undervalued' actually mean for an Indian stock?
Undervalued does not mean low price. A share quoted at ₹40 can be expensive and a share quoted at ₹4,000 can be cheap. The per-share price only tells you how thinly the company sliced its equity. What matters is what you pay for one rupee of profit, one rupee of net assets, or one rupee of cash the business actually generates.
A stock is undervalued when the market is charging less for those earnings than the business deserves — given how much money it makes on the capital it employs, how reliably it grows, and how safe its balance sheet is. That last part is the piece most people skip.
So the job has two halves. First, work out roughly what the business is worth in rupees. Second, look at what the market is charging today. If the market number sits well below your number, and you have left yourself room to be wrong, you have a candidate worth studying. Everything below is a disciplined way to do those two things without fooling yourself.
How do I use PE, PB and EV/EBITDA without getting fooled?
PE is price divided by earnings per share. If a share trades at ₹600 and earned ₹30 per share last year, its PE is 20. You are paying ₹20 for every ₹1 of annual profit. Across our universe, the median PE was 24.0 as of August 2026. That is a reference point, not a rule — it simply tells you what the middle of the Indian market costs.
Price to book compares the share price to the net assets on the balance sheet. It is most useful for banks and lenders, where the balance sheet is the business. EV/EBITDA takes the company's whole value including its debt, and divides it by operating profit before depreciation and interest. Use it when a company carries heavy debt, because PE quietly ignores borrowings.
The trap is comparing a PE to nothing. A PE of 12 means little on its own. Compare it to the company's own five-year range, to its direct competitors on NSE and BSE, and to how fast it is growing. And be careful with cyclicals like metals, sugar and chemicals: they look cheapest on PE exactly when profits have peaked, which is the worst moment to pay up.
How do I screen NSE and BSE stocks for value?
Use any free stock screener and build the filter in the right order — quality first, price second. Start with return on equity above 15% and return on capital employed above 15%. These two say the company earns a decent return on the money invested in it. Then add debt-to-equity below 1, so the returns are not just borrowed money in disguise.
Only then apply a valuation filter, such as PE between 0 and 40. Screening on cheapness first fills your list with damaged businesses, and you will spend weeks reading about companies that were never worth owning. Screening on quality first gives you a short list of good businesses, from which you wait for a few to get cheap.
One important caveat: a flat debt-to-equity rule unfairly punishes banks and NBFCs, because borrowing money is literally their business model. If you want to look at lenders, drop that filter for them and judge them on capital adequacy, asset quality and return on assets instead.
Why do so few Indian companies pass a quality-and-value filter?
Here is what the arithmetic looks like on our own universe. As of August 2026, we track 1,852 listed Indian companies, of which 1,518 have full-year fundamentals we can screen on. Of those 1,518, 458 companies (30.2%) earn ROE above 15%, and 464 (30.6%) earn ROCE above 15%. A comfortable 1,282 (84.5%) carry debt-to-equity below 1, and 988 (65.1%) trade at a PE between 0 and 40.
Each filter on its own sounds generous. Together they are brutal. Only 334 companies (22.0%) clear all three quality tests — ROE above 15%, ROCE above 15% and debt-to-equity below 1 — at the same time. Add the valuation check of PE under 40 and just 241 companies (15.9%) remain.
Read that number again, because it reframes the whole exercise. Roughly one in six listed Indian companies is both decently profitable and not obviously expensive. Your job is not to sift thousands of names. It is to know a couple of hundred well and wait. Again, remember the lender caveat — banks and NBFCs are pushed out by the debt rule, not because they are bad, but because the rule does not fit them.
How do I tell a genuinely cheap stock from a value trap?
A value trap is a stock that is cheap for a good reason and gets cheaper. The market is not always wrong. Before you decide you have found a bargain, ask what the market might be seeing that your screener cannot.
The strongest single test is cash. Pull five years of the cash flow statement and compare cumulative operating cash flow to cumulative net profit. If profits keep rising while cash does not follow, the earnings may be sitting in receivables or inventory rather than in the bank. Then look at receivable days and inventory days: if they are stretching year after year, the company is selling on ever-easier terms.
Other warning signs, in rough order of seriousness: promoter shareholding falling quarter after quarter, shares pledged against loans, an auditor resigning mid-term, large loans or advances to related parties, repeated equity dilution, and a business losing market share in a growing industry. Any one of these is a reason to slow down. Two together usually mean the discount is deserved.
What should I check in the annual report before buying?
Start with the segment disclosures. A company may look like one business and actually be three, with one of them quietly bleeding. Then read the management discussion section, and compare it against what the same section promised three years ago. Managements that reliably do what they said are worth a premium; managements that keep changing the story are worth avoiding.
Next, look at what the company does with the cash it makes. Is it reinvesting into capacity that earns a good return, paying down debt, paying dividends, or buying unrelated businesses? Capital allocation is the single biggest driver of long-run returns, and it is described in plain English in the report, not hidden in a ratio.
Finally, check the notes on contingent liabilities, tax disputes and related-party transactions. These are boring pages that most retail investors skip, which is exactly why the surprises hide there. If something in the notes does not make sense to you after two readings, treat that as a finding, not a failure of your reading.
How do I estimate what a share is worth in rupees?
You do not need a spreadsheet with thirty tabs. A simple earnings-power estimate is enough for most decisions. Take the profit the company can reasonably earn in a normal year — not its best year — and multiply it by a multiple you think that business deserves, based on its growth and consistency. Divide by the number of shares.
Here is a purely illustrative example with made-up figures: suppose a company earns a normalised ₹500 crore a year, has 10 crore shares, and you believe a steady, low-debt business of that kind deserves 18 times earnings. That gives ₹9,000 crore of value, or ₹900 per share. If the market is quoting ₹640, you are being offered roughly a 29% discount to your own estimate. These numbers are illustrative only and are not about any real company.
Then insist on a margin of safety. Your normalised profit could be wrong, and your multiple is a judgement call. Many disciplined investors want a discount of at least 25% to 30% before acting. That gap is not greed — it is the room your mistakes need to live in.
Do Indian taxes and market rules change the maths?
Yes, in ways that matter for a value strategy. Gains on listed equity held for the long term are taxed at a lower rate than short-term gains, and a portion of long-term gains each year is exempt. Since undervaluation often takes two or three years to correct, patience is not just temperamentally right here — it is also the tax-efficient path. Check the current rates and limits before you plan around them.
Market structure matters too. Settlement is fast, but liquidity is not evenly spread. Many genuinely cheap small companies trade thin, so a large order moves the price against you. Check average delivery volumes before assuming you can enter or exit at the screen price.
Also watch the surveillance framework. Stocks placed under additional surveillance or graded surveillance measures by the exchanges face restrictions such as higher margins or periodic call auctions. And on the SME platform, lot sizes are large and trading is thin, which makes small positions impractical for most retail investors.
What is a repeatable monthly routine I can follow?
Once a month, run your screen: ROE above 15%, ROCE above 15%, debt-to-equity below 1, PE under 40, with lenders judged separately. Save the output. Over a year you will notice the same names appearing, which is how you slowly build a watchlist of businesses you actually understand.
For any name that interests you, do a one-hour first pass: five years of profit versus operating cash flow, the promoter holding and pledge trend, the debt trend, and the current PE against its own five-year range. Most candidates die in that hour, and that is the point.
For survivors, write one page in your own words: what the company sells, who it competes with, what would have to go right, and what would have to go wrong. Put a rupee number on what you think it is worth, and the price at which you would act. Then wait. Do nothing until price meets your number. The waiting is the strategy, not a gap in it.
Click Here – See BossInvestor's Data-Driven Stock Screens
Conclusion
Finding undervalued stocks in India is less about clever formulas and more about order of operations: quality first, price second, cash flow always. The screening numbers make the odds plain — as of August 2026, only 15.9% of the companies we track with full-year fundamentals are both decently profitable and reasonably priced, so the discipline is in what you reject. Do the one-hour first pass, write your own page, name your price, and wait for it. If you would rather see this method already applied — the screens run and the research written up — that work lives inside the BossInvestor app after KYC.
BossInvestor is a SEBI Registered Research Analyst (INH000024143). This article is for educational and informational purposes only. It explains a method and is not investment advice, nor a recommendation to buy, sell or hold any security. Market-wide figures are computed from our universe as of August 2026; past metrics do not guarantee future results. Always do your own research or consult a registered adviser before investing.
Frequently Asked Questions
Is a stock with a low PE always undervalued?
No. A low PE can mean the market expects profits to fall, and it often does. Cyclical companies in metals, sugar or chemicals show their lowest PE at the top of the cycle, when earnings are temporarily inflated. Companies with governance problems also trade cheap for good reason. Always ask why the discount exists before assuming it is a mistake, and check whether profits are backed by operating cash flow over five years.
How many stocks should I look at before finding one worth buying?
Far more than most people expect. Our screening data as of August 2026 shows that of 1,518 listed Indian companies with full-year fundamentals, only 334 (22.0%) clear a basic quality bar of ROE above 15%, ROCE above 15% and debt-to-equity below 1 together. Adding a PE-under-40 check leaves 241, or 15.9%. From that shortlist, your own reading will eliminate most. Expect to study dozens carefully to act on a handful.
Can I use the same value screen for banks and NBFCs?
Not without changing it. A flat debt-to-equity limit unfairly penalises lenders, because borrowing money and lending it out is their business model, not a sign of stress. For banks and NBFCs, drop the debt filter and judge them instead on return on assets, capital adequacy, provisioning, gross and net non-performing assets, and the trend in those numbers. Price to book is usually more informative than PE for this group.
How long should I hold an undervalued stock?
Long enough for the gap between price and value to close, which typically takes years rather than months. There is no fixed period. Hold while the reason you bought remains true, and reconsider when the business deteriorates or the price clearly exceeds your estimate of value. In India, long-term gains on listed equity are also taxed more favourably than short-term gains, so patience tends to help returns twice over.
What is a margin of safety and how much should I use?
It is the gap between what you think a share is worth and the price you are willing to pay. If you estimate fair value at ₹900 and you buy at ₹640, your margin of safety is around 29%. It exists because your estimate could be wrong. Many disciplined investors want at least 25% to 30% for a stable business, and more for a cyclical or a smaller company. Figures here are illustrative.
Related Blogs
How to Analyse a Stock Before Buying: A 10-Point Checklist
Published: Mon Sep 07 2026Read more…

How to Calculate Your Financial Freedom Number and Achieve It
Published: Tue May 20 2025Read more…
 (1).jpg)
From Signal to Strategy: The Moving Averages
Published: Tue May 20 2025Read more…

Market Share: The Silent Signal of Competitive Power and Investment Opportunity
Published: Wed May 14 2025Read more…