How to read a balance sheet before investing
Most retail investors in India read the profit figure and stop there. This page walks you through the balance sheet line by line, in the order a professional reads it, so you can tell a genuinely strong business from one that is quietly borrowing its way to growth.

BOSSINVESTOR
Mon Sep 07 2026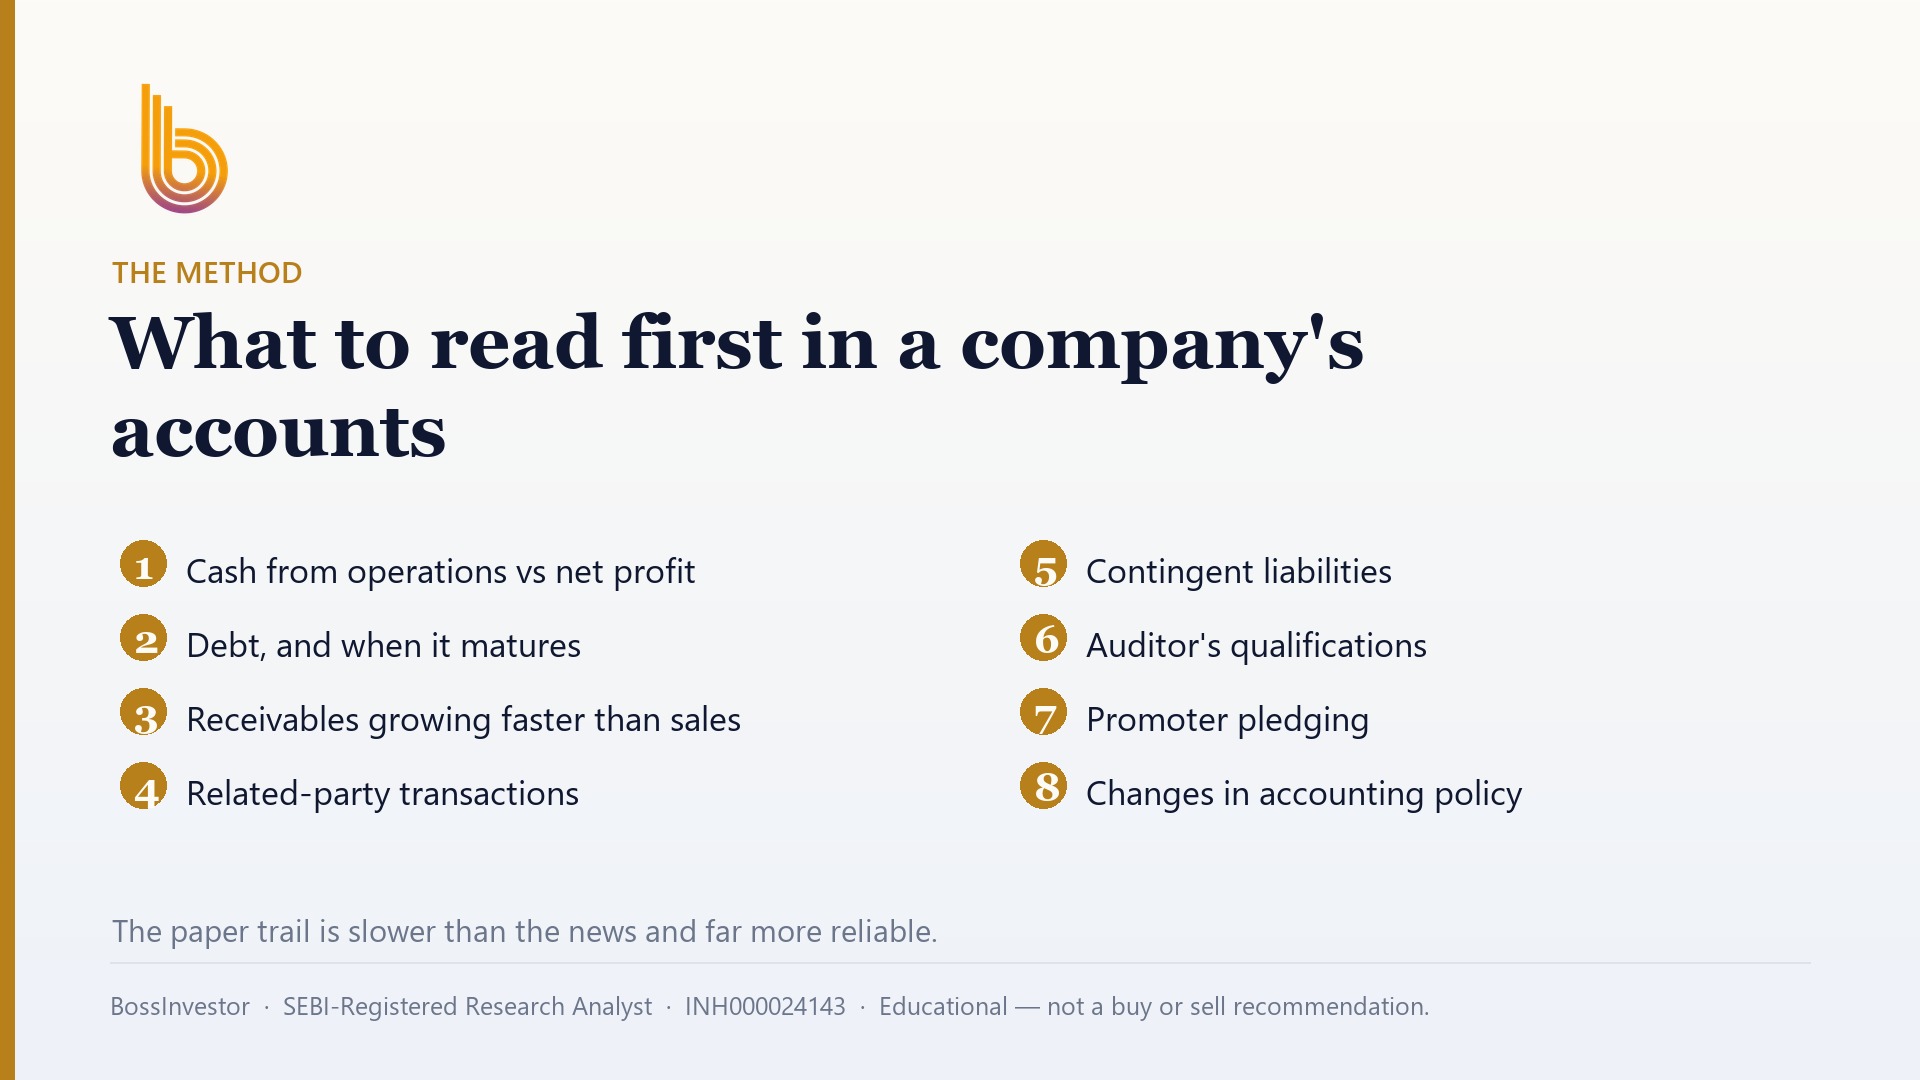
What should you look at first on a company's balance sheet?
Read a balance sheet in this order: borrowings versus shareholders' equity, then return on equity and capital employed, then receivables and inventory, then the notes for contingent liabilities and related-party loans. In our universe of 1,518 listed Indian companies with full-year fundamentals (August 2026), only 22.0% clear all three quality tests together.
Key Takeaways
- The balance sheet shows what a company owns and who paid for it, on one single date.
- Debt-to-equity below 1 is the floor, not the edge: 84.5% of our universe already clears it (August 2026).
- Only 22.0% of 1,518 companies had ROE above 15%, ROCE above 15% and debt-to-equity below 1 at the same time.
- Rising receivables and inventory alongside rising sales usually means the profit has not turned into cash yet.
- Banks and NBFCs must never be judged on a flat debt-to-equity rule; borrowing is their raw material.
- Read consolidated numbers, not standalone: in India the debt often sits in the subsidiaries.
What exactly is a balance sheet, in plain English?
A balance sheet is a photograph of a company on one single day, usually 31 March for Indian companies. It has two sides and they must match. On one side is everything the company owns: land, factories, machines, stock lying in the warehouse, money customers still owe it, cash in the bank. On the other side is where the money for all of that came from: money the owners put in plus profits kept back over the years, and money borrowed from banks, bondholders and suppliers. Assets equal equity plus liabilities. Always. That is the entire idea, and everything else is detail.
The profit and loss statement tells you what happened over twelve months. The cash flow statement tells you whether that profit became real money. The balance sheet tells you what the company is standing on right now. Most retail investors read only the P&L, see sales going up, and buy. The balance sheet is where you find out whether those sales were funded by customers actually paying, or by the company borrowing a little more every year just to stay in the game. That is the difference between a compounding business and a treadmill.
Where do I find the balance sheet of an NSE or BSE listed company?
Every listed company files its results with the exchanges. Go to nseindia.com or bseindia.com, search the company, and open the Financial Results or Corporate Announcements section. The half-yearly and annual filings carry a balance sheet; the fully detailed version, with all the notes, sits in the annual report on the company's own investor relations page. Free aggregator websites reformat the same data into ten-year tables, which is genuinely faster for a first pass. But before you put real money in, open the actual annual report at least once. Those numbers are audited. The summaries are not always complete.
Two habits will save you a lot of grief. First, read the consolidated statement, not the standalone one. Standalone covers only the parent company; consolidated adds every subsidiary, and in India that is very often where the borrowings and the loss-making side businesses are parked. Second, read the auditor's report at the front and the notes to accounts at the back. Search for the phrases 'qualified opinion', 'emphasis of matter' and 'material uncertainty related to going concern'. Finding one of those is worth more than an hour of ratio work. Ratios describe a business; those phrases describe a warning.
How much debt is too much for a company?
Start with debt-to-equity: total borrowings divided by shareholders' funds. Using purely illustrative figures, a company with ₹400 crore of borrowings sitting on ₹800 crore of equity has a debt-to-equity of 0.5. For most manufacturers and consumer businesses, under 1 is comfortable and under 0.5 is conservative. Above 2, you are effectively taking on the lender's risk while the lender takes the safer seat. Then check interest coverage: operating profit divided by interest cost. Below three times, a single bad year can push the company into trouble it cannot easily borrow its way out of.
Also look at the split between short-term and long-term borrowings. A company that keeps rolling over working capital loans to pay for a plant that will only earn money in four years is running one of the oldest accidents in Indian markets. Here is the part that surprises people: low debt is not rare. In our universe as of August 2026, 1,282 of the 1,518 companies with full-year fundamentals, or 84.5%, already carry debt-to-equity below 1. So a clean debt figure is the entry ticket, not the reason to buy. It only tells you the company will probably survive.
How do I check whether the company earns enough on the money it uses?
Two numbers, both built from the balance sheet. Return on equity is net profit divided by shareholders' funds, and it tells you what the owners earn on their own money. Return on capital employed is operating profit divided by equity plus debt together, and it tells you what the whole pool of capital earns, borrowed money included. ROCE is the honest one, because a company can flatter its ROE simply by borrowing more. If ROCE is sitting below what the company pays its bankers, then every rupee of expansion is quietly destroying value, no matter how good the sales growth looks.
Now the scale of the filter. As of August 2026, of the 1,518 listed Indian companies in our universe with full-year fundamentals, only 458 companies, or 30.2%, had ROE above 15%. Only 464, or 30.6%, had ROCE above 15%. And when you ask for all three at once, ROE above 15%, ROCE above 15% and debt-to-equity below 1, just 334 companies clear it, which is 22.0%. Roughly four out of five listed Indian companies fail a basic quality bar. That single fact is why reading the balance sheet before you buy matters more than any tip you will hear.
What does working capital tell me about the quality of the business?
Working capital is the money stuck in day-to-day operations: stock in the warehouse, bills customers have not paid yet, minus the bills the company itself has not paid its suppliers. On the balance sheet these show up as inventories, trade receivables and trade payables. A good business collects fast, holds little stock and pays suppliers on normal terms. A struggling one does the opposite, and the balance sheet shows it long before the profit line does. This is the single most useful section for spotting a company whose growth is real versus one whose growth is only on paper.
The test is a ratio of growth rates, not absolute numbers. Take purely illustrative figures: sales rise 30% in a year while trade receivables rise 70%. That company is not selling more, it is lending more. It is shipping goods to distributors who have not paid, booking the revenue, and hoping. Do this comparison across three or four years, not one, because a single year can be distorted by a large March order. If receivables and inventory keep outrunning sales year after year, the profit in the P&L will eventually be written back as a bad debt.
Which balance sheet red flags should I never ignore?
Contingent liabilities come first. These are obligations that are not on the balance sheet yet but could land on it: disputed tax demands, guarantees given to group companies, pending legal claims. They are disclosed in the notes. If the total is large compared to the company's net worth, you must understand why. Next, loans and advances to related parties. Money flowing from a listed company to promoter-owned entities is a structural risk to you as a minority shareholder, however routine the explanation sounds. Then check whether the share count keeps rising every year through fresh issues; constant dilution silently shrinks your slice.
A few more that take thirty seconds each. Large cash on the books alongside large interest costs: using illustrative numbers, a company holding ₹500 crore in cash while paying interest on ₹500 crore of loans needs a very good reason, because the arithmetic makes no sense otherwise. A ballooning 'other current assets' line with no explanation in the notes. An auditor resigning or being replaced mid-term. And promoter share pledging, which the promoters disclose separately to the exchanges rather than in the balance sheet, but which tells you how stretched the people running the company actually are.
Do these balance sheet rules apply to banks and NBFCs as well?
No, and this is where a lot of retail screening goes wrong. For a bank or an NBFC, borrowing is the raw material. Deposits and borrowed funds are what the business buys cheap and lends dear. A debt-to-equity of six or eight times is completely normal there and says nothing bad about the company. Any flat debt-to-equity rule, including the under-1 screen behind our 84.5% figure, unfairly penalises financial companies. If you run that screen across the whole market, you will quietly delete most of the banking and lending sector for no real reason.
For lenders, read a different set of lines. Look at gross and net non-performing assets and whether they are trending down. Look at the provision coverage ratio, which shows how much of the bad loans the company has already set aside money for. Look at the capital adequacy ratio, which the RBI mandates a floor for. For banks, the share of low-cost current and savings account deposits matters, because cheap deposits are a durable advantage. And look at net interest margin. Same discipline, different instruments. Judge a lender on loan quality and funding cost, never on a manufacturer's ratios.
How does the balance sheet connect to the price I am actually paying?
A strong balance sheet at any price is not an investment, it is a hope. Book value per share comes straight off the balance sheet: shareholders' funds divided by the number of shares. Price-to-book compares the market price to that. For asset-heavy businesses like manufacturing or cement, price-to-book is a useful sanity check. For asset-light businesses like software services, book value means very little, because their real asset is people and it never appears on the balance sheet. Use the tool that fits the business rather than applying one ratio to everything.
Then combine quality with what you pay. As of August 2026, the median price-to-earnings ratio across our universe is 24.0. When we add a valuation check to the quality bar, asking for PE under 40 on top of ROE above 15%, ROCE above 15% and debt-to-equity under 1, we go from 334 companies down to 241, or 15.9% of the 1,518 with full-year fundamentals. Fewer than one in six. One more Indian-specific point: gains on listed shares held beyond twelve months get the lower long-term rate, so the balance sheet you are reading should be one you are comfortable holding through at least one full year.
What is a simple checklist I can run in fifteen minutes?
Open the consolidated annual report and do these in order. One, scan the auditor's opinion for any qualification. Two, calculate debt-to-equity and interest coverage, and note the short-term versus long-term split. Three, calculate ROE and ROCE, and compare ROCE to the interest rate the company is paying. Four, compare five-year growth in receivables and inventory against five-year growth in sales. Five, read the contingent liabilities note and the related-party transactions note. Six, check whether the share count has increased. Seven, work out book value per share and see what you are paying for it.
Do this for five companies and something changes in how you invest. You stop asking 'is this stock going up' and start asking 'is this a business that earns more than it borrows'. Most of the companies you were excited about will fail step two or step four, and you will not lose money on them, which is the quiet half of returns that nobody posts about. The balance sheet will not tell you what a share is worth tomorrow. It will tell you, quite reliably, which companies do not deserve your money at any price.
Click Here – See BossInvestor's Data-Driven Stock Screens
Conclusion
The balance sheet is the least glamorous statement and the most protective one. Borrowings versus equity, returns on capital, working capital trends, then the notes: that order takes fifteen minutes and removes most of the ways retail investors lose money in Indian equities. As of August 2026, only 22.0% of the 1,518 companies with full-year fundamentals in our universe clear a basic quality bar at all, and 15.9% clear it at a reasonable price. Learn the method here for free; if you want to see which specific names sit in that narrow group and what we are doing about them, that work sits behind KYC in the BossInvestor app.
BossInvestor is a SEBI Registered Research Analyst (INH000024143). This article is for educational and informational purposes only. It explains a method and is not investment advice, nor a recommendation to buy, sell or hold any security. Market-wide figures are computed from our universe as of August 2026; past metrics do not guarantee future results. Always do your own research or consult a registered adviser before investing.
Frequently Asked Questions
Should I read the standalone or consolidated balance sheet?
Read the consolidated one whenever both are available. Standalone shows only the parent company. Consolidated combines every subsidiary and joint venture, and in Indian groups that is frequently where the borrowings, the loss-making side businesses and the related-party exposures actually sit. A parent company can look almost debt-free on a standalone basis while the group it controls is heavily leveraged. If the two versions differ a lot, that gap is itself the thing worth investigating before you invest a rupee.
Is a debt-free company always a safe investment?
No. Debt-free only means the company is unlikely to go bankrupt soon; it says nothing about whether the business earns a decent return. In our universe as of August 2026, 84.5% of companies with full-year fundamentals already have debt-to-equity below 1, so low debt is common rather than special. Plenty of them earn poor returns on capital and grow slowly. Always pair the debt check with return on equity and return on capital employed before you conclude anything.
How many years of balance sheets should I look at?
At least five, and ten if the data is available. A single year tells you almost nothing, because one large March order, one asset sale or one write-off can distort every ratio. What you want is direction. Are borrowings shrinking or growing? Is return on capital employed stable or drifting down? Are receivables growing faster than sales year after year? Trends across five years are far harder for a company to manage than any single reporting date.
Why can't I judge a bank using debt-to-equity?
Because borrowing is a lender's business model, not a warning sign. Banks and NBFCs raise deposits and funds cheaply and lend them at higher rates, so a debt-to-equity of six or eight times is entirely normal and healthy. A flat under-1 debt rule wrongly rejects almost the entire financial sector. For lenders, look instead at gross and net non-performing assets, provision coverage, capital adequacy, net interest margin, and for banks the share of low-cost current and savings account deposits.
What is the single fastest red flag to check on a balance sheet?
Compare the growth in trade receivables against the growth in sales over the last three to five years. If money owed by customers is consistently growing faster than revenue, the company is booking sales it has not been paid for. That gap is where reported profit and actual cash quietly separate, and it usually appears in the balance sheet well before it appears as a write-off in the profit and loss statement. It takes about two minutes to check.
Related Blogs
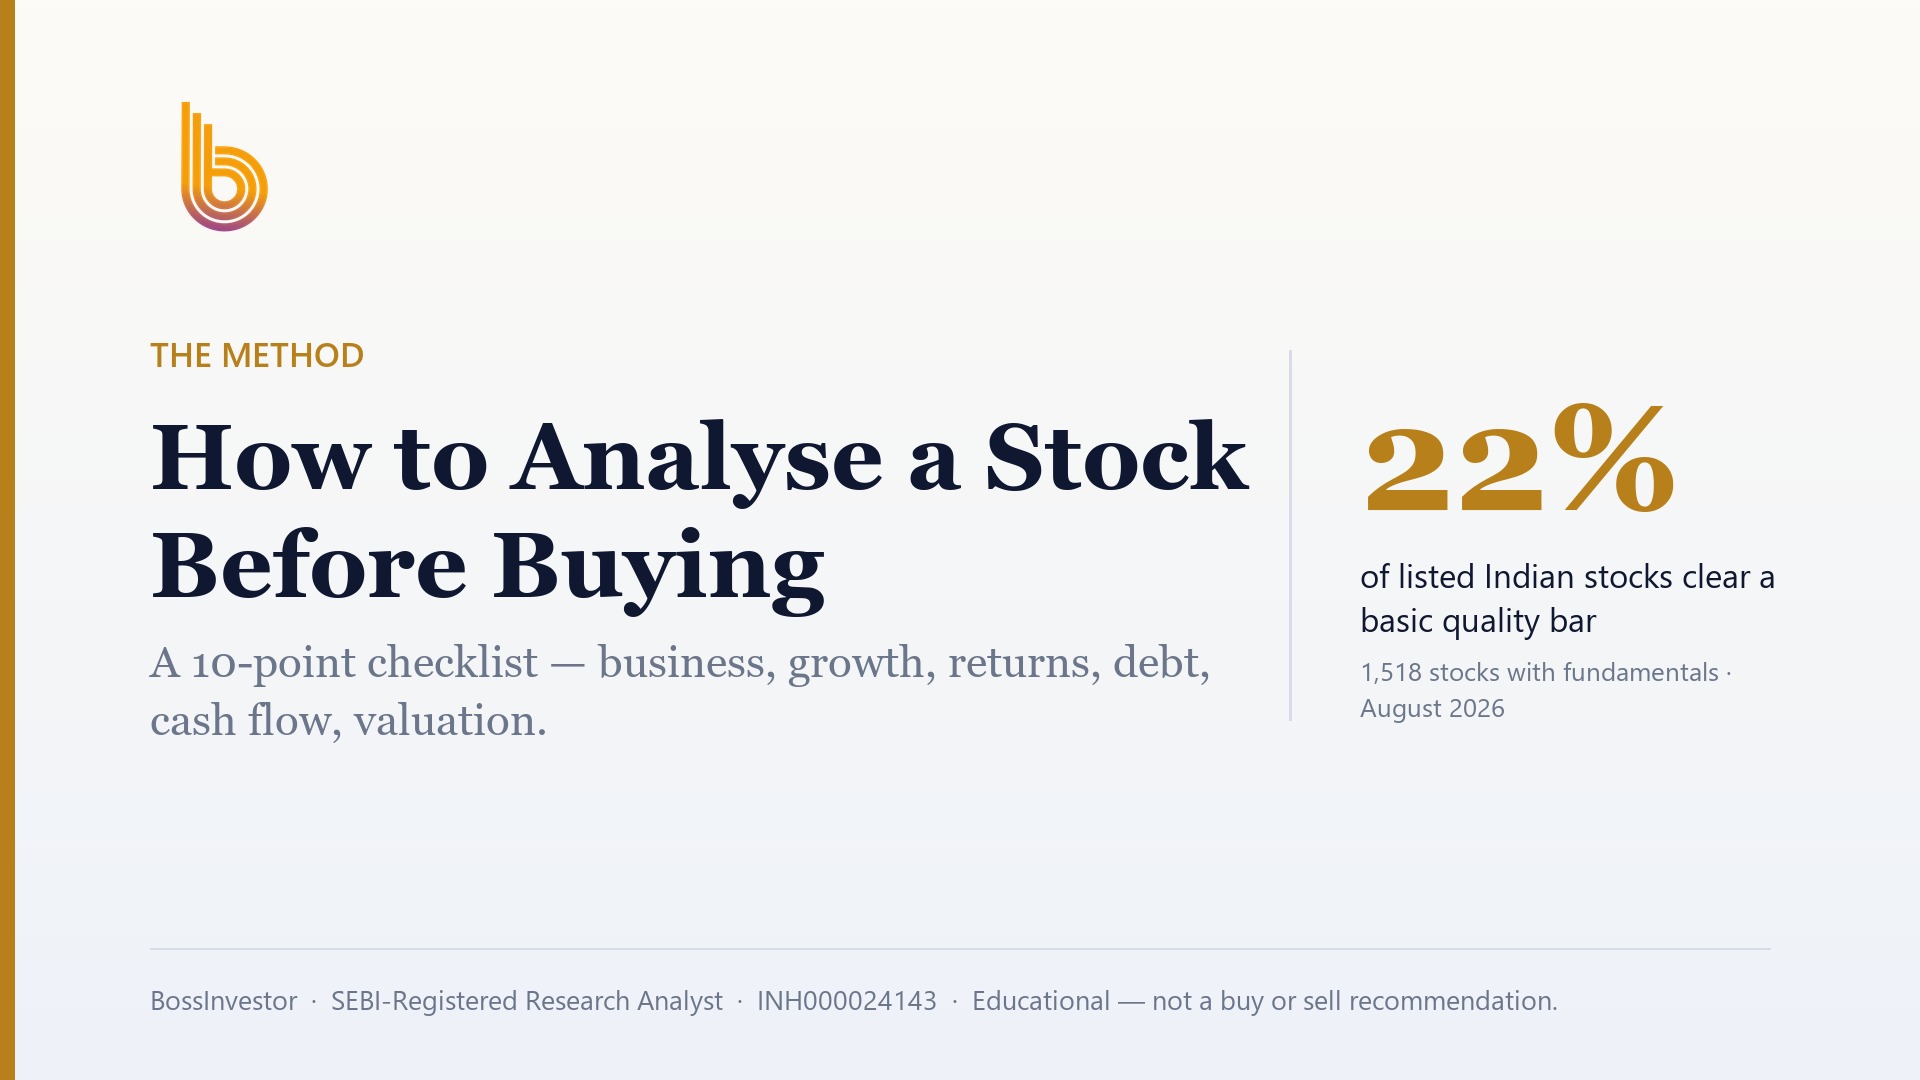
How to Analyse a Stock Before Buying: A 10-Point Checklist
Published: Mon Sep 07 2026Read more…

How to Calculate Your Financial Freedom Number and Achieve It
Published: Tue May 20 2025Read more…
 (1).jpg)
From Signal to Strategy: The Moving Averages
Published: Tue May 20 2025Read more…

Market Share: The Silent Signal of Competitive Power and Investment Opportunity
Published: Wed May 14 2025Read more…