How to read a cash flow statement
Profit is an opinion. Cash is a fact. This page walks you through an Indian annual report's cash flow statement line by line, shows you the three blocks, the five-year check that exposes fake profits, and the red flags worth walking away from.

BOSSINVESTOR
Mon Sep 07 2026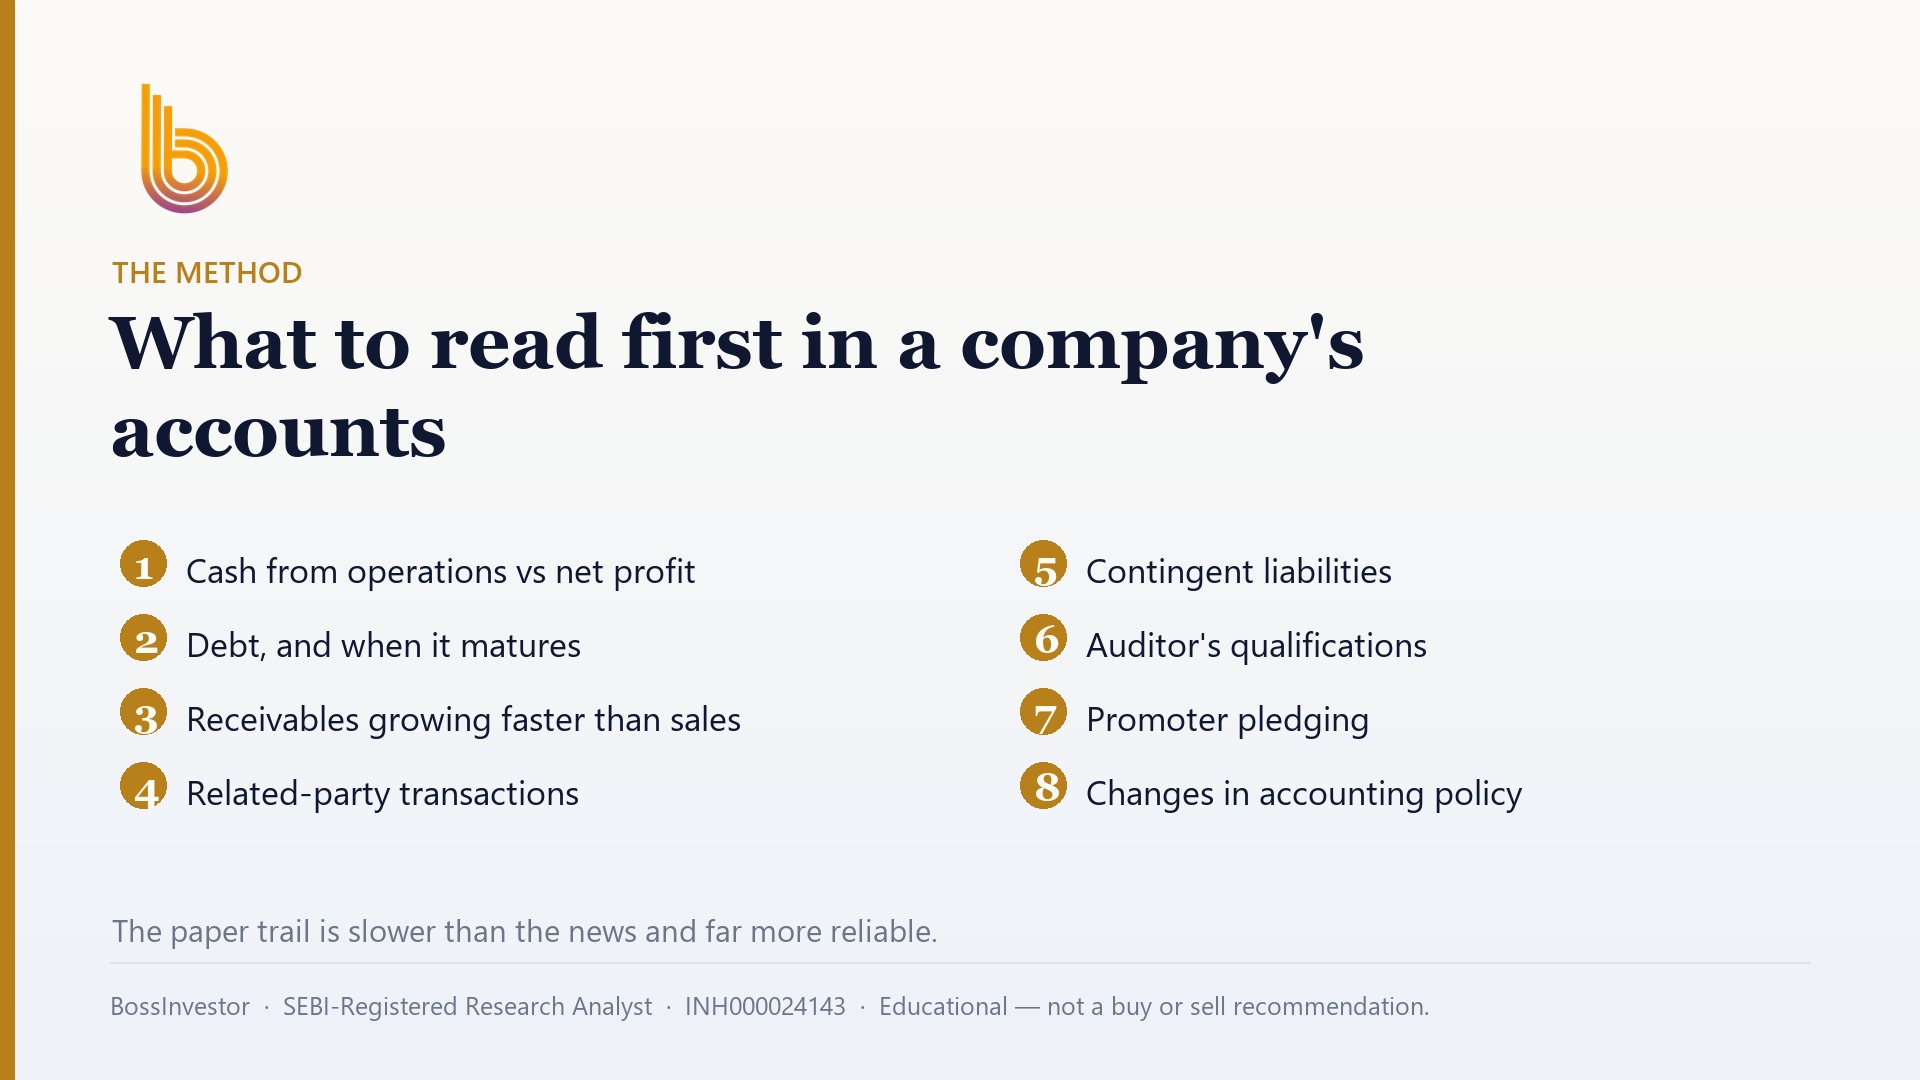
What is the simplest way to read a company's cash flow statement?
Read a cash flow statement in three blocks: operating, investing and financing. Start with cash from operations, the real money the business collected. Compare it to net profit over five years. If profit keeps rising while operating cash lags, the profit is on paper. Then subtract capex to see free cash flow.
Key Takeaways
- Cash from operations is the first number to read, not the last.
- Over five years, operating cash should roughly track net profit. A permanent gap is a warning.
- Free cash flow = operating cash minus capex. That is what is actually left for you.
- Negative investing cash is normal for a growing company; negative operating cash rarely is.
- Financing cash tells you who is paying for the growth: you, the bank, or the business itself.
- Banks and NBFCs need a different reading; lending flows distort the operating block.
What is a cash flow statement, and why does it matter more than the profit figure?
A cash flow statement is the record of actual rupees that entered and left a company's bank accounts during the year. Nothing else. It does not care about bills raised, orders booked or revenue recognised. It only tracks money that moved.
The profit and loss statement is different. It records a sale the day the invoice is raised, even if the customer pays eleven months later, or never. It spreads the cost of a plant over fifteen years through depreciation, even though the entire amount left the bank in one go. Those are accounting judgements. Reasonable people can disagree on them, and dishonest people can stretch them.
Cash has no such flexibility. A company can report a profit of a few hundred crore rupees and still not have the money to pay salaries, because that profit is sitting in unpaid invoices and unsold inventory. Under Indian accounting standards every listed company on the NSE and BSE must publish this statement in the annual report, and under SEBI's listing rules also at the half-year mark. If you read only one statement in a slow, careful way, make it this one.
What are the three sections of a cash flow statement?
Every cash flow statement in India is split into the same three blocks, in the same order.
Operating activities is the day job. Money in from customers, money out to suppliers, employees, landlords and the tax department. This is cash the business generates by doing what it says it does.
Investing activities is what the company buys and sells for the long term. New machinery, a factory, land, software, a stake in another company. Money spent here shows as a negative number. Money received from selling an old asset shows as a positive one.
Financing activities is dealings with lenders and shareholders. Loans taken, loans repaid, interest paid, dividends paid, shares issued, shares bought back.
The three blocks add up to the change in the cash balance for the year. The bottom of the statement will tie back to the cash and bank line on the balance sheet. If it does not tie, you have misread something.
How do I read cash from operations first?
Indian companies use what is called the indirect method, which is why the operating block looks confusing at first. It does not start with cash received. It starts with profit before tax, then adds back and subtracts a list of items to convert that profit into cash.
Read it as a conversion. Depreciation is added back because it was a cost on paper, not a payment. Interest cost is usually added back here and shown in the financing block instead. Then come the working capital changes: trade receivables, inventory, trade payables. An increase in receivables is subtracted, because the sale happened but the cash did not arrive. An increase in payables is added, because you kept your supplier's money a little longer. Finally, taxes actually paid are subtracted.
The number at the bottom of the block is net cash from operating activities. That is the honest measure of what the business earned in cash this year. Look at it for five years, not one. One weak year can be a big order stuck in a customer's payment cycle. Five weak years is the business model.
What does it mean when profit is high but operating cash flow is low?
This is the single most useful check on the page, and the one most retail investors skip. Put net profit and operating cash flow side by side for five financial years. Add each column up. Then compare the two totals.
If five-year operating cash is roughly in line with five-year profit, the profit is being collected. If operating cash is consistently far below profit, ask where the money went. Usually it is in one of two places: receivables, meaning customers are not paying, or inventory, meaning goods are not selling. Both show up clearly in the working capital lines you just read.
An illustrative example, with made-up figures. Suppose a company reports profit of ₹100 crore in each of five years, so ₹500 crore in total, but cumulative operating cash flow over the same five years is ₹180 crore. Meanwhile trade receivables have climbed from ₹90 crore to ₹410 crore. That pattern says the sales are real on paper but the cash is stuck with customers. It may be aggressive channel stuffing, a stressed customer base, or simply a bad business to be in. In every case, the reported profit is not yours.
How do I calculate free cash flow for an Indian company?
Free cash flow is the number that decides whether a company can pay you a dividend, repay a loan or buy back shares without borrowing to do it. The calculation is simple: take net cash from operating activities, then subtract purchase of property, plant and equipment, plus any capital work in progress and intangible assets bought. All of those sit in the investing block.
Ignore the other investing lines for this purpose. Money moved into or out of mutual funds and fixed deposits is treasury management, not the business. Proceeds from selling a plant are one-off. You want the recurring picture.
An illustrative example with rounded figures: operating cash flow of ₹640 crore, capex of ₹250 crore, so free cash flow of ₹390 crore. If the company also paid ₹120 crore in dividends and ₹90 crore in loan repayment that year, both were comfortably funded from the business itself. That is the shape you want. Negative free cash flow is not automatically bad, because a genuinely expanding manufacturer will outspend its cash flow for a few years. It is bad when it persists for a decade with nothing to show for it in revenue or margins.
What do the investing and financing sections tell me about management?
The investing block is where management's intentions show up before they appear in the results. Heavy, rising capex year after year means they are betting on demand. Track it against revenue over the following three years. If capex went up 3x and revenue did not move, the capital was destroyed, whatever the annual report letter says.
Watch for loans and advances given to related parties, or investments in subsidiaries you have never heard of. This is where promoter money can quietly leave a listed company. The line item will be small and dull. Read it anyway, and cross-check the related party transactions note.
The financing block answers one question: who is paying for the growth? If a company is generating cash and using it to repay debt and pay dividends, financing cash flow will be negative, and that is healthy. If financing cash flow is large and positive year after year, because of fresh loans or repeated share issues, the growth is being bought with someone else's money. Every rupee raised that way either adds interest cost or shrinks your share of the company.
What are the red flags to look for in a cash flow statement?
There is a short list worth memorising. Operating cash flow negative in two or more of the last five years, in a company that claims to be profitable. Operating cash flow far below profit for five straight years. Receivables growing faster than sales, year after year. Dividends and interest being paid entirely out of fresh borrowing rather than operations.
Then there are the presentation tricks. Interest paid parked in the operating block in one year and the financing block in the next, which flatters the comparison. Large one-off asset sales dressed up as if they were routine. Sudden changes in how the company classifies items, without explanation in the notes.
Finally, read the auditor's report and the notes on contingent liabilities in the same sitting. A qualified opinion, or a repeated emphasis of matter about recoverability of receivables, will usually confirm exactly what the cash flow statement is already hinting at. Two independent signals pointing the same way is worth acting on.
How does cash flow fit with ROE, ROCE and debt when I screen stocks?
Cash flow is the verification step, not the filter. You cannot easily screen 1,800 companies on cash flow quality, but you can narrow the list first and then read the statements of what survives.
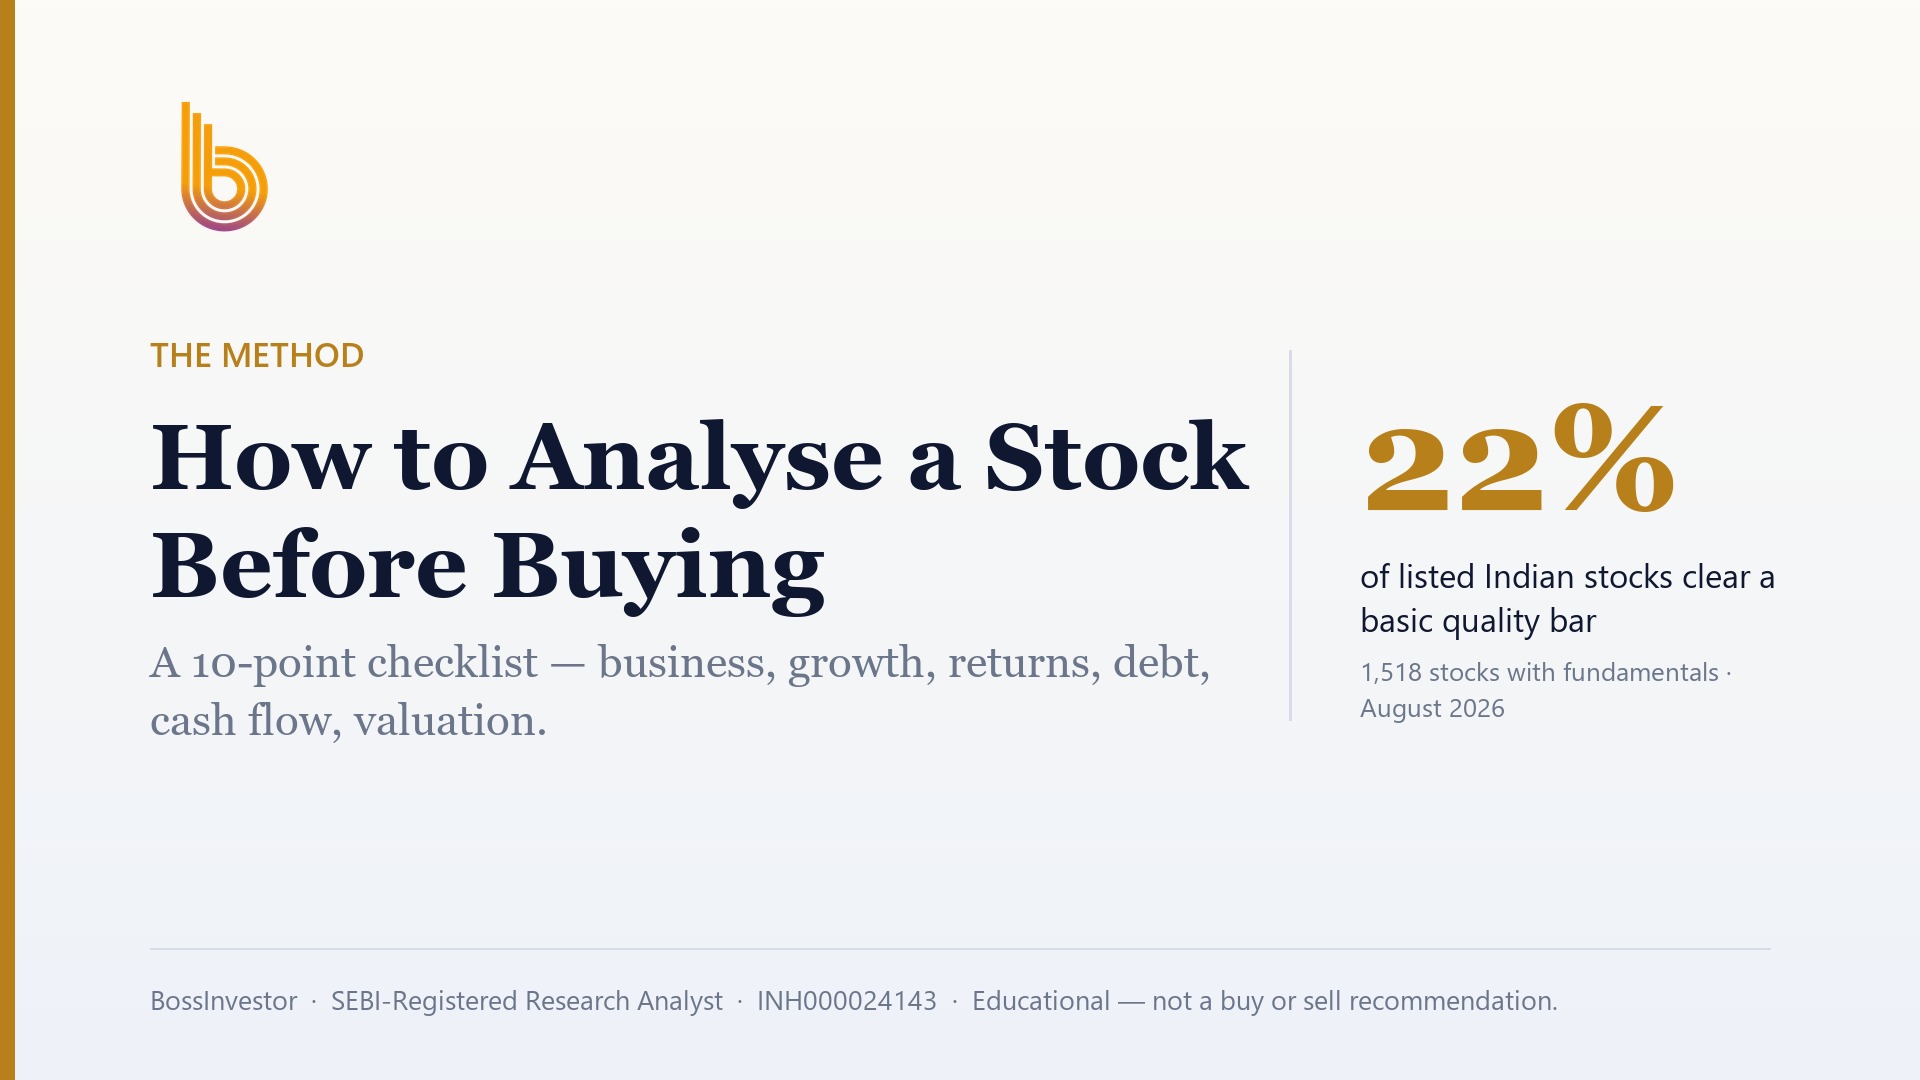
In our own universe, as of August 2026, we track 1,852 listed Indian companies, of which 1,518 have full-year fundamentals. Only 22.0% of those clear a basic quality bar of return on equity above 15%, return on capital employed above 15% and debt-to-equity below 1 at the same time. Add a simple valuation check of a price-to-earnings ratio under 40 and you are left with 15.9%. For context, the median price-to-earnings ratio across that universe is 24.0.
One caveat on the debt screen. Banks and non-banking finance companies are unfairly penalised by a flat debt-to-equity rule, because borrowing is literally their business model. Do not throw them out on that basis alone.
So the workflow is: screen down to a few hundred names on returns and debt, then open the cash flow statements of the ten or twenty you actually find interesting. High ROE with weak operating cash flow is the combination that catches people out, and only the cash flow statement will show it to you.
How do I read a bank or NBFC cash flow statement differently?
For a lender, loans given out are the core business, so they sit inside operating activities. That means a bank or NBFC growing its loan book fast will show a large negative operating cash flow. For a manufacturer that would be alarming. For a lender it just means it is lending.
So read the drivers instead. Deposits raised and borrowings taken tell you how the lending is being funded. A lender funded by stable retail deposits is in a different position from one dependent on short-term wholesale borrowing that has to be rolled over every few months. That difference is what turns into a crisis when credit markets tighten.
For lenders, the cash flow statement is a supporting document. The numbers that decide the outcome are asset quality, provisioning, net interest margin and the funding mix. Read those first, and use the cash flow statement to confirm that borrowings and deposits are moving the way management described.
Click Here – See BossInvestor's Data-Driven Stock Screens
Conclusion
Reading a cash flow statement is not a skill you need a finance degree for. It is a sequence: operating cash first, five years side by side against profit, then capex subtracted to get free cash flow, then investing and financing to see who is funding the growth. Do that on a dozen companies and the pattern of a healthy business becomes obvious. If you would rather see this method already applied, with the screening and the statement-level checks done for you, that work sits inside the BossInvestor app after KYC.
BossInvestor is a SEBI Registered Research Analyst (INH000024143). This article is for educational and informational purposes only. It explains a method and is not investment advice, nor a recommendation to buy, sell or hold any security. Market-wide figures are computed from our universe as of August 2026; past metrics do not guarantee future results. Always do your own research or consult a registered adviser before investing.
Frequently Asked Questions
Where do I find the cash flow statement of an Indian listed company?
In the annual report, right after the profit and loss statement and balance sheet. Every listed company publishes it on its own investor relations page and on the NSE and BSE websites, usually under financial results or annual reports. Under SEBI's listing rules companies must also publish a cash flow statement at the half-year mark, so you get a mid-year update. Free financial data sites reproduce ten-year cash flow histories, which is useful for the five-year comparison against profit.
Is negative cash flow always a bad sign?
No, and this trips people up. Negative investing cash flow is normal and often healthy, because it means the company is buying assets to grow. Negative financing cash flow is usually good, because it means loans are being repaid and dividends paid. Negative operating cash flow is the one that matters, and even that can be acceptable for a young company or a fast-growing lender. What you cannot ignore is negative operating cash flow in a mature, supposedly profitable business.
What is the difference between free cash flow and operating cash flow?
Operating cash flow is the cash the business generated before spending anything on new assets. Free cash flow is what remains after subtracting capital expenditure, meaning purchases of plant, machinery, buildings and intangibles. Free cash flow is the stricter test, because a company must keep replacing worn-out equipment simply to stay in business. Money that is committed to maintaining the existing operation was never really available to shareholders in the first place, so free cash flow is the more honest figure.
How many years of cash flow statements should I look at?
Five years at minimum, and ten if the data is available. One year tells you almost nothing, because a single large order, a delayed customer payment or a one-off tax settlement can distort any single period. Patterns are what you are hunting for: does operating cash consistently track profit, is capex producing revenue growth, is the company repaying debt or constantly raising more. A full business cycle, ideally including one bad year for the industry, shows you far more than a good year does.
Do dividends and buybacks show up in the cash flow statement?
Yes, both sit in the financing activities block as cash outflows. Dividend paid appears as a single line, often shown together with dividend distribution effects. Share buybacks appear separately as purchase of treasury shares or a similar description. Check these against free cash flow. If a company pays out more than it generates after capex, the money must be coming from borrowing or from cash reserves, and neither is sustainable for long. Consistent payouts funded from operations are the sign of a genuinely cash-generating business.
Related Blogs
How to Analyse a Stock Before Buying: A 10-Point Checklist
Published: Mon Sep 07 2026Read more…

How to Calculate Your Financial Freedom Number and Achieve It
Published: Tue May 20 2025Read more…
 (1).jpg)
From Signal to Strategy: The Moving Averages
Published: Tue May 20 2025Read more…

Market Share: The Silent Signal of Competitive Power and Investment Opportunity
Published: Wed May 14 2025Read more…