How to read a profit and loss statement
Most investors open a results PDF, look at the net profit number, and close it. That is how you get trapped. This page walks you down an Indian P&L line by line, shows you which lines are real and which ones can be dressed up, and gives you a checklist you can run in ten minutes on any NSE or BSE listed company.

BOSSINVESTOR
Mon Sep 07 2026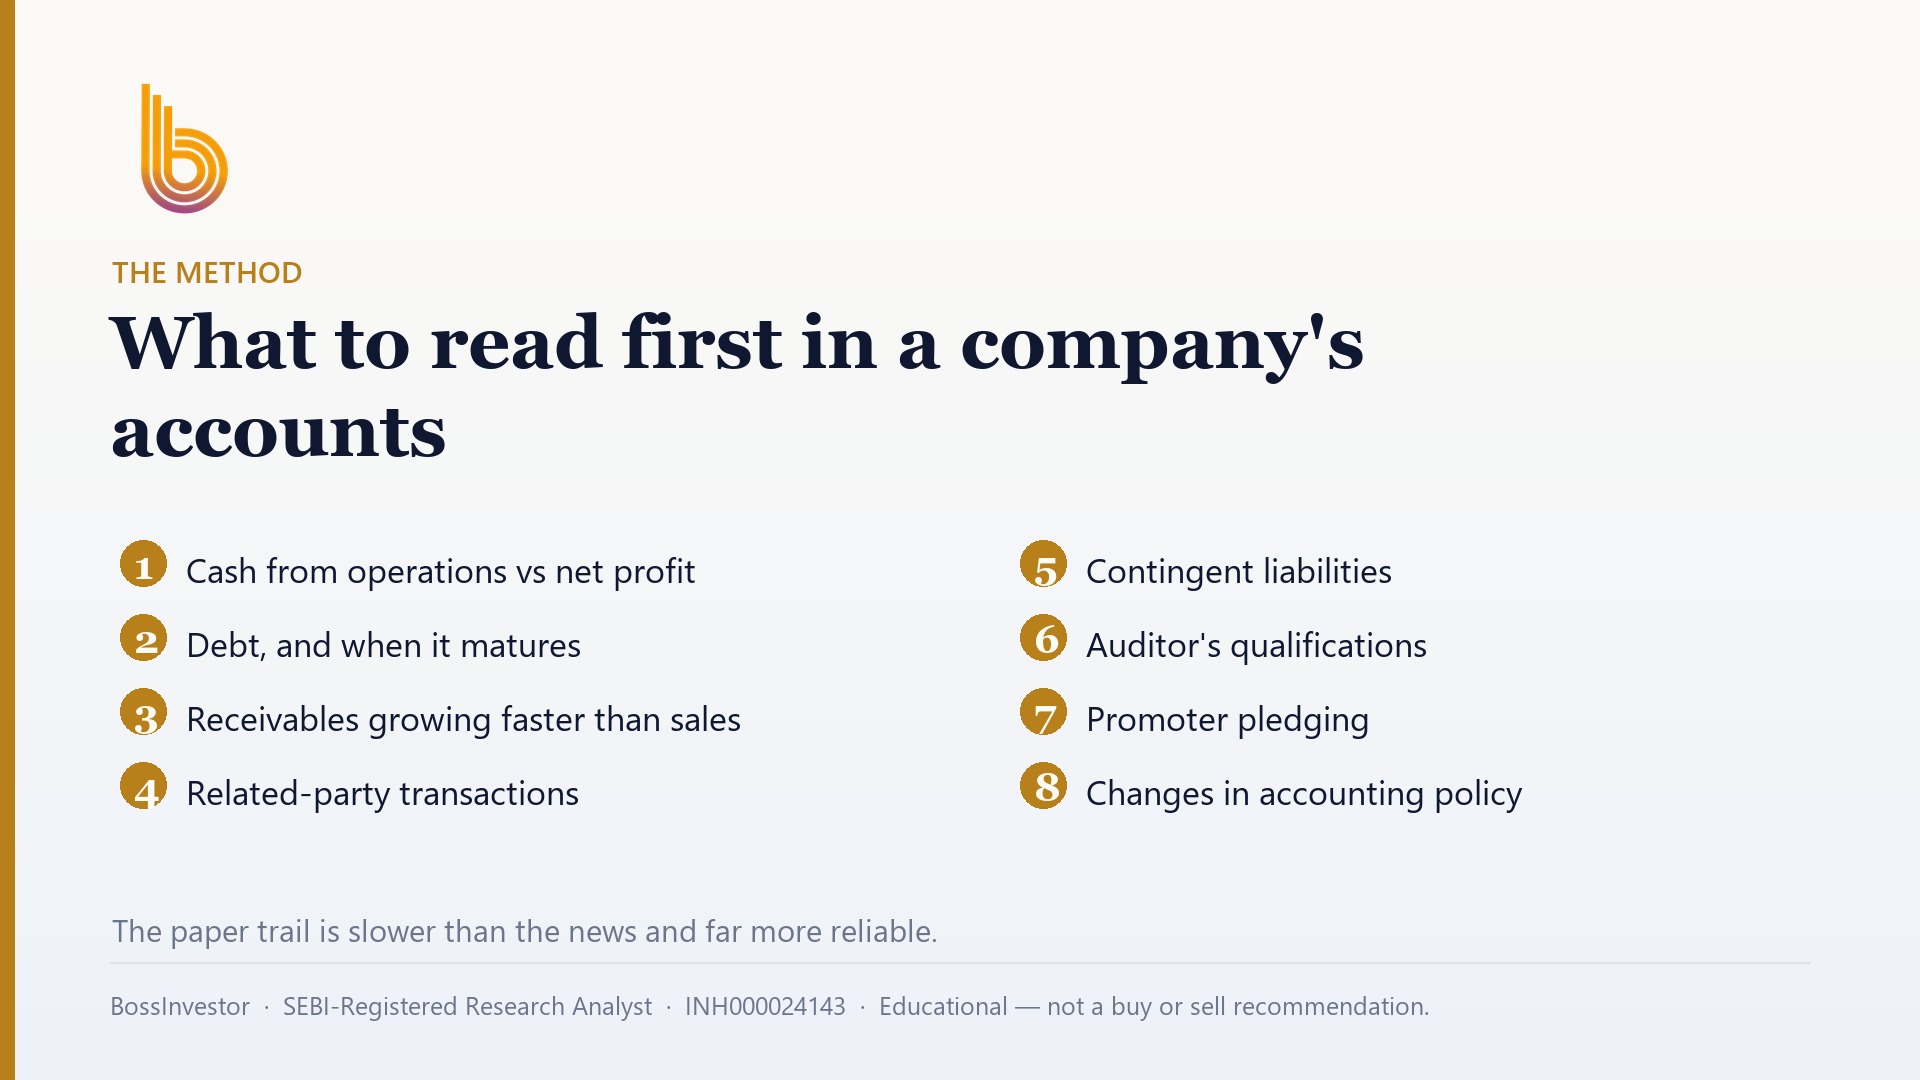
What is the right way to read a company's P&L as a retail investor?
Read a profit and loss statement top to bottom in five lines: revenue, operating profit, other income, interest and tax, and net profit. Compare each with the same quarter last year, not the previous quarter. If profit grows only because other income or a tax credit jumped, the business has not actually improved.
Key Takeaways
- Net profit is the last line, not the most important one. Operating profit is.
- Always compare a quarter with the same quarter last year, because most Indian businesses are seasonal.
- Other income is interest, dividends and one-off gains. Strip it out before you judge the business.
- For a company with subsidiaries, read consolidated numbers, not standalone.
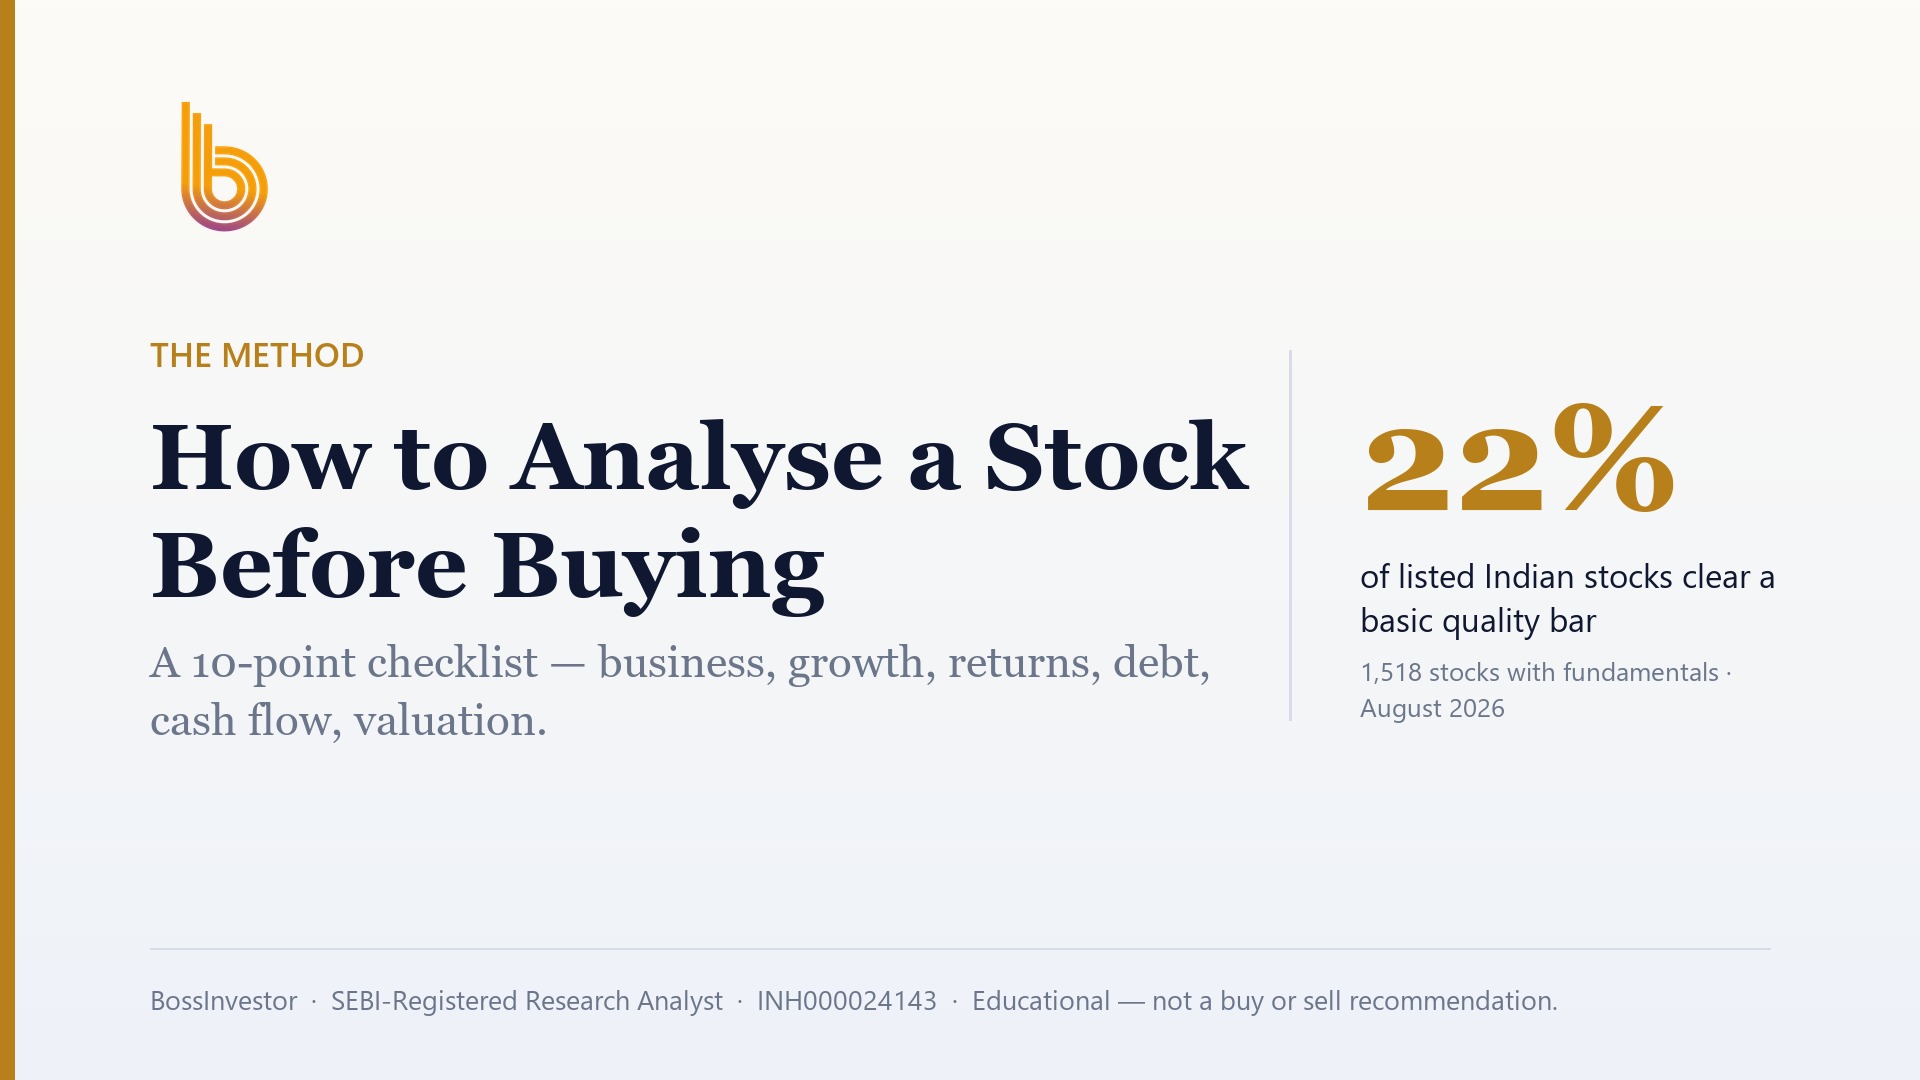
- As of August 2026, only 22.0% of 1,518 Indian companies with full-year fundamentals clear a basic quality bar of ROE above 15%, ROCE above 15% and debt-to-equity below 1 together.
- A P&L tells you what was earned on paper. Always cross-check it against the cash flow statement.
What is a profit and loss statement, and where do I find it for an Indian company?
A profit and loss statement, also called the income statement or the statement of profit and loss, is a report of what a company earned and what it spent over a period of time. A quarter, or a full financial year from April to March. It answers one question: after paying for everything, how much was left?
Every company listed on the NSE or BSE has to file it. You will find it in three places, all free. The exchange website, under the company's corporate announcements, usually as a PDF titled Financial Results. The company's own investor relations page. And the annual report, which carries the audited full-year version along with the notes.
Two words on the file itself. Quarterly results are usually unaudited or limited-reviewed. The full-year numbers in the annual report are audited. When something looks strange in a quarter, wait for the annual report and read the notes before you conclude anything. The notes are where the real story usually sits.
What are the main line items in an Indian P&L, from revenue down to net profit?
The layout is standardised, so once you learn it for one company you can read any of them. It starts with Revenue from Operations. This is money earned from the actual business: selling cement, lending money, running a hospital. Below that sits Other Income, which is everything else, and the two together give Total Income.
Then come the expenses, in a block. Cost of materials consumed. Purchases of stock-in-trade. Changes in inventories, which can be a positive or negative number and confuses everybody the first time. Employee benefits expense, which is salaries. Finance costs, which is interest paid on borrowings. Depreciation and amortisation, which is the annual wear-and-tear charge on factories, machines and intangibles. And Other Expenses, a catch-all bucket for power, freight, rent, advertising and professional fees.
Total income minus total expenses gives Profit Before Tax. Subtract tax expense and you get Profit After Tax, the net profit. Below that you will see Earnings Per Share, basic and diluted, and sometimes Other Comprehensive Income, which you can ignore for most everyday analysis. That is the whole structure. Ten or twelve lines, and you have read a P&L.
Why is operating profit more important than net profit?
Operating profit is what the core business earned before interest, tax, depreciation and other income. In India it is commonly quoted as EBITDA. It is not printed as a separate line in the standard format, so you compute it: revenue from operations minus the operating expenses, which means everything except finance costs and depreciation. Operating profit divided by revenue from operations gives the operating profit margin.
Why does this matter more than the last line? Because net profit is affected by things that have nothing to do with how well the company sells its product. A one-time tax refund. A gain from selling a piece of land. A change in the interest rate on borrowings. Operating profit strips all that away and shows you the engine.
Here is an illustrative example, with made-up figures. Suppose a company reports revenue of ₹1,000 crore and net profit of ₹120 crore, up from ₹100 crore last year. Looks like 20% profit growth. But other income jumped from ₹10 crore to ₹45 crore because it sold a warehouse. Operating profit actually fell from ₹150 crore to ₹135 crore. The business got worse. The headline said it got better. That gap is where retail investors lose money, and reading two extra lines closes it.
Should I read standalone or consolidated results?
Indian companies file both. Standalone covers only the parent company. Consolidated adds in the subsidiaries, joint ventures and associates the parent controls or has a stake in. If a company has any meaningful subsidiaries, read consolidated. That is the whole group, and that is what you own a slice of when you buy the share.
This matters more than it sounds. A parent can look clean on a standalone basis while a loss-making subsidiary quietly bleeds cash. Or the reverse: the parent is a small holding entity and almost all the earnings sit in subsidiaries, so standalone numbers look tiny and meaningless. The line to look for in consolidated results is share of profit or loss of associates and joint ventures, and the split of profit between owners of the parent and non-controlling interest. That second one tells you how much of the profit actually belongs to you rather than to minority shareholders in a subsidiary.
A practical habit: check both, once. If the two are nearly identical, the company is essentially standalone and you can stop checking. If they diverge a lot, that divergence itself is worth understanding before you invest.
How do I tell if other income is propping up the profit?
Other income is interest on fixed deposits, dividends from investments, foreign exchange gains, rental income, and profit on sale of assets or investments. It is legitimate income. It is just not the business. A cement company should make money selling cement, not selling land.
The test is simple. Take other income and divide it by profit before tax. If that ratio is small, say well under a tenth, the profit is coming from operations and you can move on. If it is a large slice, or if it swung sharply from last year, go to the notes and find out what it was. A company sitting on a large cash pile will genuinely earn steady treasury income, and that is fine and repeatable. A one-time gain from selling a subsidiary is not repeatable, and pricing the stock as if it is will hurt you.
Do the same check in reverse for expenses. Look for exceptional items, a separate line that appears above or below profit before tax. Write-offs, restructuring costs, impairment of goodwill, provisions for a legal case. These are usually one-offs too. Mentally add them back or take them out and ask what the normal year looks like.
What do the finance cost, depreciation and tax lines actually tell me?
Finance costs are interest on debt. Compare this line to operating profit. If interest is eating a big share of operating profit, the company is working for its lenders before it works for you. A rising finance cost while revenue stays flat usually means new borrowing, and you should check the balance sheet to see where the money went. Note the caveat for banks and NBFCs here: for them borrowing is the raw material, so interest cost is a business input, not a warning sign, and flat debt rules do not apply.
Depreciation is a non-cash charge. No rupee leaves the company, but the P&L records the ageing of plant and machinery. A sudden fall in depreciation while assets keep growing deserves a look in the notes. Companies sometimes change the useful life assumption on assets, which lowers the annual charge and lifts reported profit without anything real changing.
For tax, compute the effective tax rate: tax expense divided by profit before tax. In India the headline corporate tax rate for most companies is in the low twenties plus surcharge and cess, so the effective rate for a normal manufacturer typically lands in a fairly narrow band. A rate far below that, year after year, is worth understanding. It could be a tax holiday on a new plant, accumulated losses being set off, or a deferred tax entry. All of those are real, and all of them eventually end.
How should I compare one quarter with another?
Compare a quarter with the same quarter of the previous year. Q2 of this year against Q2 of last year. This is year-on-year, and it is the honest comparison for almost every Indian business, because seasonality is enormous here. A festive quarter beats a monsoon quarter for a consumer company almost automatically. Comparing October-December with July-September and calling it growth is meaningless.
Quarter-on-quarter has its uses, mainly for spotting a turn early in a business you already understand well. But treat it as a supporting signal, not the headline. And when a company presents a nine-month or year-to-date figure, check whether the base period is comparable, especially after a merger, demerger or a big acquisition. Numbers after such an event are often simply not comparable with the prior year, and the company will usually say so in a footnote that nobody reads.
One more habit worth building: look at four to five years of annual P&Ls side by side, not one quarter in isolation. Revenue growth, operating margin and net profit across five years tell you whether this is a business that compounds or a business that had one good year.
What are the biggest red flags to look for in a P&L?
Profit rising while revenue is flat or falling, with no clear cost-cutting story. Operating margin expanding suddenly and sharply with no explanation in the management commentary. Other income doing the heavy lifting. An effective tax rate that stays oddly low for years. Exceptional items appearing every single year, which means they are not exceptional at all, they are the business.
The single most useful cross-check sits outside the P&L. Open the cash flow statement and find cash generated from operations. Compare it with the profit after tax over the same period, and ideally over three to five years together. Profit is an accounting opinion. Cash is a fact. If a company keeps reporting profit but operating cash flow is consistently much lower, the profit is sitting in receivables or inventory rather than in the bank. That single comparison catches more problems than any ratio.
Also read the auditor's line. A qualified opinion, an emphasis of matter, or a resignation by the auditor is a serious signal and it is printed right there in the filing. Most retail investors never open it.
How does the P&L connect to ratios like ROE and ROCE?
The P&L gives you the numerator for most quality ratios. Return on equity takes net profit and divides it by shareholders' equity from the balance sheet. Return on capital employed takes operating profit, roughly EBIT, and divides it by the total capital the business uses, equity plus debt. So the moment you can read a P&L properly, you can compute these yourself instead of trusting a screener blindly.
That matters because the bar is higher than most people assume. From our own universe of 1,852 listed Indian companies as of August 2026, 1,518 had full-year fundamentals available. Of those, 30.2% had ROE above 15% and 30.6% had ROCE above 15%. But only 22.0% cleared ROE above 15%, ROCE above 15% and debt-to-equity below 1 all at the same time. Add a simple valuation check, PE under 40, and you are left with 15.9%. The median PE across that set was 24.0.
One caveat on that debt screen. Banks and NBFCs get unfairly knocked out by a flat debt-to-equity rule, because borrowing is literally their business model. For lenders you need a different frame entirely: net interest margin, provisions, and asset quality, not a debt ratio. Use the quality screen as a first filter for the rest of the market, then read the actual P&L of whatever survives. The screen narrows the field. The statement tells you whether the business is real.
Click Here – See BossInvestor's Data-Driven Stock Screens
Conclusion
Reading a P&L is a habit, not a talent. Go down the five lines every time: revenue, operating profit, other income, interest and tax, net profit. Compare year-on-year, read consolidated, and cross-check profit against operating cash flow before you believe anything. Once the method is yours, the numbers stop being intimidating and start being useful. If you would rather see which companies currently pass this test in our tracked universe, that view sits inside the BossInvestor app after KYC.
BossInvestor is a SEBI Registered Research Analyst (INH000024143). This article is for educational and informational purposes only. It explains a method and is not investment advice, nor a recommendation to buy, sell or hold any security. Market-wide figures are computed from our universe as of August 2026; past metrics do not guarantee future results. Always do your own research or consult a registered adviser before investing.
Frequently Asked Questions
What is the difference between EBITDA and net profit?
EBITDA is earnings before interest, tax, depreciation and amortisation. It measures what the core operations earned before financing decisions, accounting charges and taxes. Net profit is what remains after all of those are deducted. EBITDA tells you how good the business is at its job. Net profit tells you what actually reached the shareholders. A company can have healthy EBITDA and poor net profit if it carries heavy debt, so read both together rather than picking one.
Where can I get an Indian company's P&L for free?
The NSE and BSE websites carry every listed company's quarterly and annual filings under corporate announcements or financial results, usually as PDFs. The company's own investor relations page has the same documents plus presentations and earnings call transcripts. The annual report, also free on both, carries the audited full-year P&L with the notes to accounts. You do not need a paid data service to read a statement. You only need to know where to look.
Should I compare a quarter with the previous quarter or the same quarter last year?
Compare with the same quarter of the previous year. Indian businesses are heavily seasonal, so a festive quarter will almost always beat a monsoon quarter regardless of how the business is actually doing. Year-on-year comparison removes that distortion. Quarter-on-quarter can help you spot a turning point in a business you already understand well, but treat it as a secondary signal. Also check for mergers or demergers that make the base period non-comparable.
How do I know if reported profit is real?
Cross-check it against the cash flow statement. Find cash generated from operations and compare it with profit after tax across three to five years. If profit is consistently far higher than operating cash flow, the earnings are stuck in receivables or inventory rather than in the bank. Also check whether other income or one-off exceptional gains are doing the work, and read the auditor's report for any qualification or emphasis of matter.
What is a good operating profit margin for an Indian company?
There is no universal number, because it depends entirely on the industry. A software services firm and a commodity trader operate on completely different margin structures, and comparing them is meaningless. The useful test is relative: compare a company's operating margin with its own history over four to five years, and with two or three direct competitors in the same industry. A margin that is stable or improving against both benchmarks is the signal you want, not any absolute threshold.
Related Blogs
How to Analyse a Stock Before Buying: A 10-Point Checklist
Published: Mon Sep 07 2026Read more…

How to Calculate Your Financial Freedom Number and Achieve It
Published: Tue May 20 2025Read more…
 (1).jpg)
From Signal to Strategy: The Moving Averages
Published: Tue May 20 2025Read more…

Market Share: The Silent Signal of Competitive Power and Investment Opportunity
Published: Wed May 14 2025Read more…