How do you read a shareholding pattern and promoter pledging?
Every listed Indian company publishes its ownership structure four times a year, for free, in a standard format. This page shows you exactly which rows to read, how to compute pledging on the correct base, and which combinations of numbers have historically preceded trouble.

BOSSINVESTOR
Mon Sep 07 2026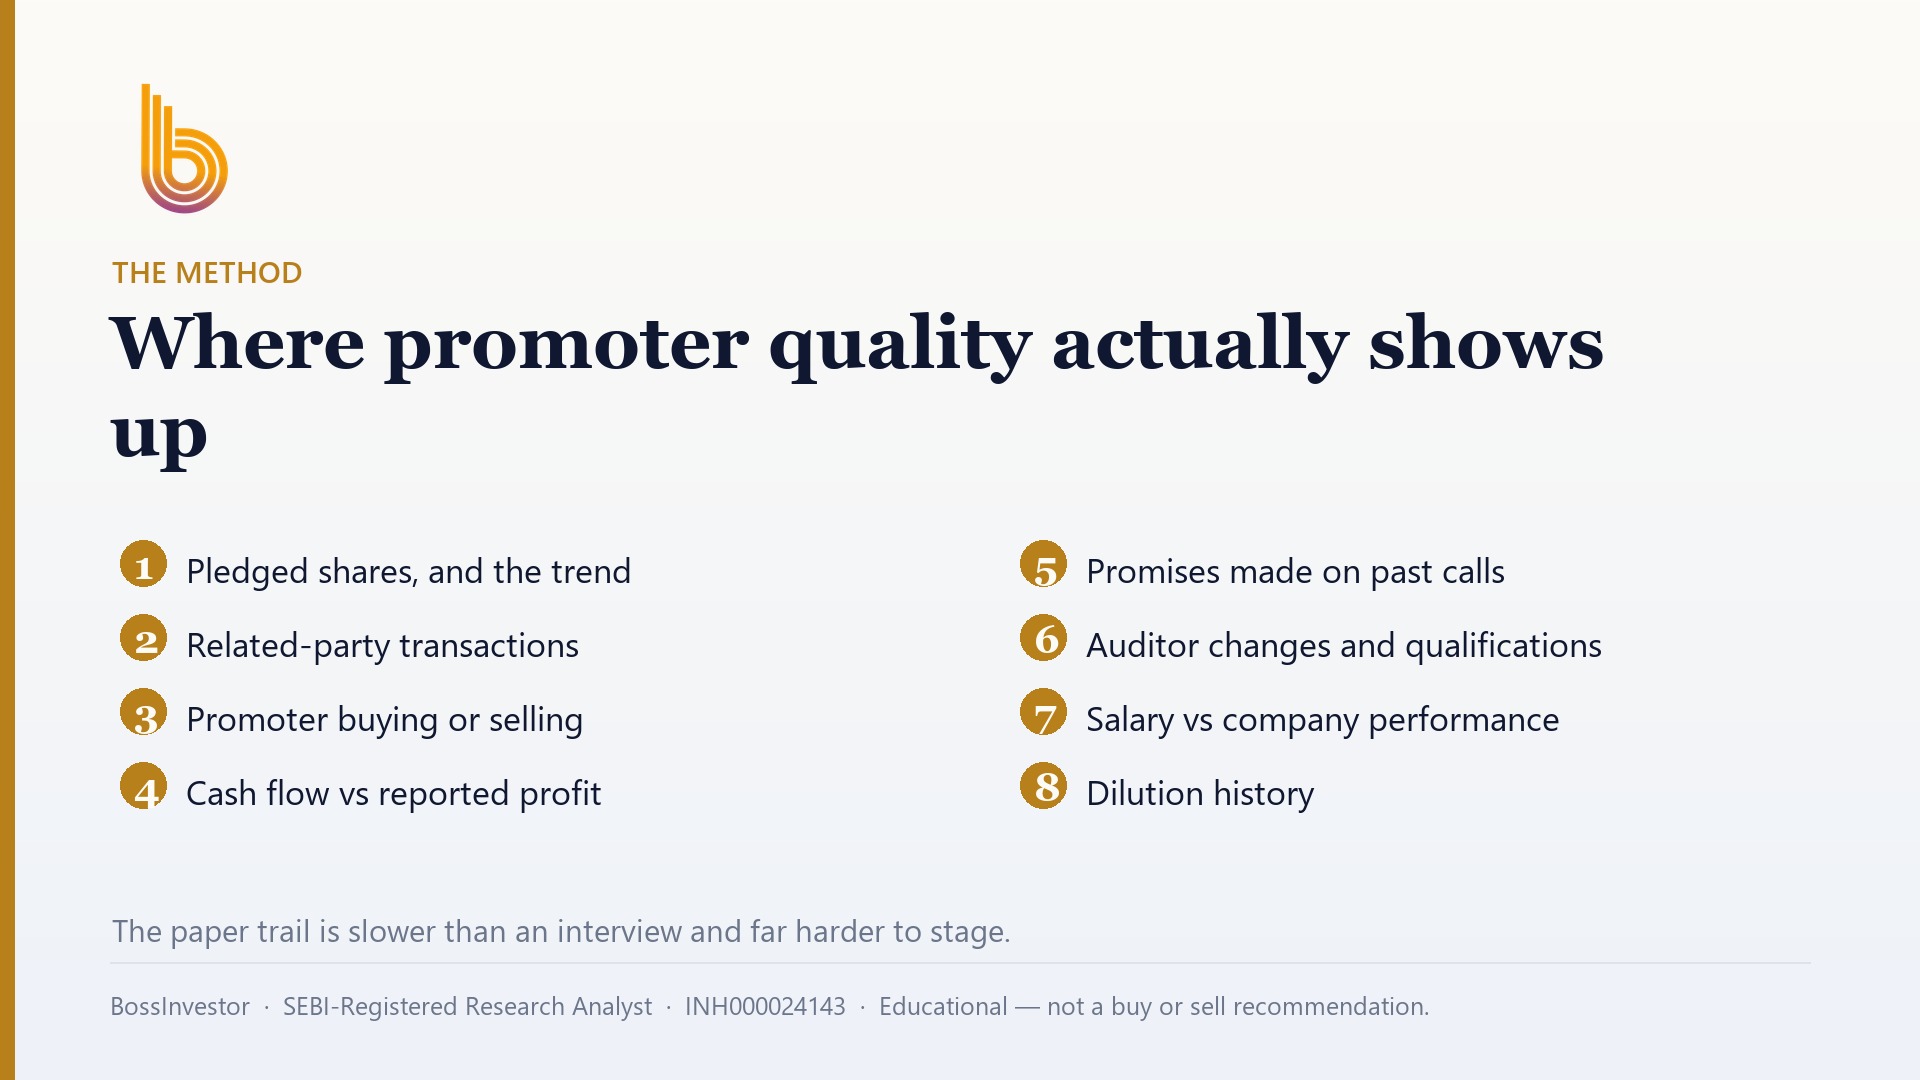
What should an Indian investor actually look for in a company's shareholding and pledge disclosures?
Open the company's quarterly shareholding pattern on the NSE or BSE website. Check four things: promoter stake and its trend, pledged shares as a percentage of promoter holding, institutional ownership by FPIs and domestic funds, and the shareholder count. Rising pledge alongside falling promoter stake is the warning combination.
Key Takeaways
- The shareholding pattern is filed quarterly under SEBI LODR and is free on NSE, BSE and the company's investor relations page.
- One quarter tells you almost nothing; pull the last eight quarters and read the trend.
- Pledging must be computed twice: as a percentage of promoter holding and as a percentage of total equity.
- Encumbrance is wider than pledge and includes non-disposal undertakings and negative liens.
- A clean ownership table says nothing about business quality: as of August 2026, only 22.0% of 1,518 companies with full-year fundamentals cleared a basic quality bar.
- The dangerous pattern is a pledge that keeps rising while the share price keeps falling.
Where do I find a company's shareholding pattern on NSE or BSE?
Every listed Indian company has to file it. Under SEBI's Listing Obligations and Disclosure Requirements regulations, the shareholding pattern goes to the exchanges within 21 days of the end of every quarter. That means fresh data lands in late July, late October, late January and late April. It costs you nothing.
On the NSE website, search the company, open its page, and go to the 'Shareholding Pattern' tab. On BSE, use the Corporates section and pick Shareholding Pattern. The same document sits on the company's own website under Investor Relations. All three are the same filing, so use whichever loads faster for you.
The format is fixed by SEBI, which is a gift. Table I is the summary. Table II is the promoter and promoter group. Table III is the public. Table IV is the non-promoter, non-public bucket, which is usually ESOP trusts or depository receipt custodians. Because the layout never changes, you can line up eight quarters side by side and spot the drift in a couple of minutes. Do that. A single quarter is a photograph. Eight quarters is a story.
Which rows in the shareholding pattern actually matter?
Start with the promoter and promoter group total. That is the family or founding entity, plus everyone SEBI considers acting with them. Note the exact percentage, not a rounded one, because the interesting movements are often half a percent at a time.
Then split the public column properly. Foreign portfolio investors, mutual funds, insurance companies, banks, alternative investment funds and NBFCs are the professional money. Below them sit individual shareholders, and SEBI splits these into those holding up to two lakh rupees of nominal share capital and those above it. Bodies corporate, NRIs and trusts sit alongside.
Now read the column almost everyone skips: the number of shareholders. If the count of small individual holders is climbing steeply while mutual funds and FPIs are shrinking, professional money is handing stock to retail. That is not automatically bad, but it is information you are getting for free.
Finally, check the fully diluted figures and the locked-in shares. Outstanding warrants, convertibles and ESOPs are future shares. A promoter who looks like they hold 55% today may hold less once warrants issued to someone else convert.
What does a change in promoter holding actually tell me?
Not every fall is sinister. Promoter holding drops for dull, legitimate reasons: a fresh issue of shares to institutions dilutes everyone, ESOPs vest, a family member transfers stock to another family member, the company does a QIP to fund a plant. Promoters can also buy more, up to 5% in a financial year through the creeping acquisition route.
So read the footnotes below the table before you react. Then cross-check the company's other filings. Substantial acquisition and takeover disclosures tell you when a large block moved. Insider trading disclosures tell you when a promoter or designated person bought or sold. If a 4% drop has an announcement behind it, you know what happened.
There is also a ceiling. Indian listed companies must keep at least 25% public shareholding, so a private promoter cannot sit above 75%. If you see promoter holding drifting down towards that line from well above it, the seller may simply be complying with a rule.
What deserves your attention is the quiet decline. Half a percent, then another half a percent, quarter after quarter, with no announcement and no explanation. That silence is louder than one large, well-explained block sale.
What is promoter pledging and why does the market fear it?
A pledge means the promoter has handed shares to a lender as collateral for a loan. The lender may be a bank, an NBFC or a mutual fund debt scheme. Promoters must disclose it, and it appears in the shareholding pattern in the column for shares pledged or otherwise encumbered.
Note the phrase 'otherwise encumbered'. SEBI widened this deliberately. An encumbrance is any restriction on the shares, including non-disposal undertakings and negative liens, not just a formal pledge. A company can show zero pledge and still have encumbered promoter stock, so read the wider disclosure, not only the word 'pledge'.
Here is why the market treats it as a live wire. The lender fixes a cover ratio, meaning the shares must stay worth some multiple of the loan. If the share price falls, the cover breaks and the lender issues a margin call. The promoter must pledge more shares or repay cash. If they cannot, the lender invokes the pledge and sells those shares in the open market.
That selling pushes the price down further, which breaks the cover again, which triggers more selling. Pledging turns an ordinary price fall into a mechanical supply shock. The promoter's personal borrowing has become your stock's problem.
How much promoter pledging is too much?
First, fix your denominator, because two different numbers get quoted and they are not the same. Pledge as a percentage of promoter holding is the big, scary one you see in headlines. Pledge as a percentage of total share capital is the one that tells you how much stock could actually hit the market. Compute both, every time.
Here is an illustrative example using made-up figures. Suppose promoters own 50% of a company and 40% of their holding is pledged. That is 20% of the entire equity sitting with lenders. Now suppose promoters own only 20% and 40% of that is pledged. Same headline number, but only 8% of equity is encumbered. Same 40%, very different exposure.
As rough working guides, not rules: nil pledge is cleanest. Below roughly 10% of promoter holding is often routine working capital arrangement. Above 25% deserves a written explanation from management. Above 50% and you are underwriting the promoter's personal balance sheet along with the business.
Level matters less than direction and purpose. Falling pledge, disclosed and explained, is a good trend. Rising pledge to fund an unrelated group company, in a family with several other businesses, is the version that ends badly.
Which combinations in the data are genuine red flags?
Single numbers rarely tell you much. Combinations do. Watch for rising pledge together with falling promoter stake, because that usually means invocations have already started and the shares have quietly moved from the promoter row to the public row.
Watch for pledge percentage rising while the share price is falling. That is often not new borrowing at all. It is the lender demanding more shares as top-up collateral for the same loan, which means the cover is already stressed.
Watch for institutional holding shrinking for three or four straight quarters while the count of small individual shareholders balloons. Watch for promoter stock held through a holding company that itself carries debt, because the leverage may be one layer above what you are reading. Watch for repeated release-and-re-pledge churn, which suggests constant refinancing rather than a stable facility.
Finally, read the ownership table next to the boring governance signals: auditor resignations, delayed filings, growing related-party loans, frequent changes in the chief financial officer. Pledging stress rarely arrives alone. When two or three of these line up in the same quarter, you have a reason to reduce your position size well before you have proof of anything.
Does a clean shareholding pattern mean the business is any good?
No, and this trips up a lot of people. The shareholding pattern is governance and ownership data. It says nothing about whether the company earns a decent return on the money it employs. A promoter can hold 62% with zero pledge and still run a business that destroys capital every year.
Some scale from our own screening universe, as of August 2026. We track 1,852 listed Indian companies, of which 1,518 have full-year fundamentals available. Only 22.0% of those 1,518 clear a basic quality bar of return on equity above 15%, return on capital employed above 15% and debt-to-equity below 1, all at the same time. Add a simple valuation check of a price-to-earnings ratio under 40 and you are left with 15.9%. The median price-to-earnings ratio across the universe is 24.0.
One honest caveat: a flat debt-to-equity screen is unfair to banks and NBFCs, because borrowing money is literally their business model. Judge lenders on capital adequacy and asset quality instead.
The practical takeaway is about sequence. Use quality and valuation to build a shortlist. Then use the shareholding pattern and pledge data to eliminate names from that shortlist. Ownership data is a very good disqualifier and a very poor qualifier.
How do I turn this into a ten-minute quarterly routine?
Build a simple sheet, one row per quarter, eight quarters deep. Columns: promoter percentage, pledge as a percentage of promoter holding, pledge as a percentage of total capital, FPI percentage, domestic institutional percentage, and the number of individual shareholders. Fill it once, then update one row every quarter. Ten minutes.
Then read the footnotes under the filing, because that is where the explanations hide. Cross-check any large move against the takeover and insider trading disclosures on the exchange website. Check whether warrants or ESOPs are pending conversion, since those change the denominator later.
Put four calendar reminders in your phone, roughly three weeks after each quarter ends. That is when the fresh filings appear and when nobody else is looking.
One last habit, and it is the one that saves money. Before you check, write down in a sentence what would make you sell. For example: pledge crossing a level you have decided on, or institutions exiting for three consecutive quarters. Deciding your exit rule before you see the numbers is the difference between reading data and rationalising a loss you are already carrying.
Click Here – See BossInvestor's Data-Driven Stock Screens
Conclusion
Reading a shareholding pattern is not clever analysis. It is a repeatable ten-minute routine done four times a year on free, standardised exchange filings, and it works because most people never bother. Use it to disqualify, never to confirm, and always compute pledging on both denominators before you form an opinion. If you would rather see this screening run across the full universe with the quality and valuation filters already applied, that work sits behind KYC inside our app.
BossInvestor is a SEBI Registered Research Analyst (INH000024143). This article is for educational and informational purposes only. It explains a method and is not investment advice, nor a recommendation to buy, sell or hold any security. Market-wide figures are computed from our universe as of August 2026; past metrics do not guarantee future results. Always do your own research or consult a registered adviser before investing.
Frequently Asked Questions
How often is the shareholding pattern updated?
Once a quarter. Under SEBI's listing regulations, every listed company must file its shareholding pattern with the exchanges within 21 days of the quarter ending. In practice, the fresh data appears in late July, late October, late January and late April. It is published free on the NSE and BSE websites and on the company's investor relations page. Because the format is standardised by SEBI, you can compare eight quarters side by side without any adjustment.
Are pledged shares and encumbered shares the same thing?
No, and the difference matters. A pledge is shares given to a lender as collateral for a loan. An encumbrance is broader and covers any restriction on those shares, including non-disposal undertakings and negative liens. SEBI deliberately widened the definition so promoters could not hide obligations outside a formal pledge. A company can therefore report zero pledge while promoter shares are still encumbered, so read the full disclosure line, not just the word pledge.
What actually happens when a pledge is invoked?
The lender takes ownership of the pledged shares and usually sells them in the open market to recover its money. Two things follow. Promoter holding falls, and those shares shift into the public category in the next shareholding pattern. And the selling itself pushes the price down, which can break the collateral cover on any remaining pledged shares and trigger further invocation. That feedback loop is why the market reacts sharply to pledge stress rather than waiting for confirmation.
Can an Indian promoter hold more than 75% of a listed company?
Generally no. SEBI requires listed companies to maintain at least 25% public shareholding, which caps private promoters at 75%. Certain government companies and recently listed or restructured entities get specific timelines or exemptions. This is why you sometimes see promoter holding drift downward from a high level with no distress behind it. Before treating a fall as a warning, check whether the company was simply bringing itself into compliance with the minimum public shareholding rule.
Should I avoid every company with any promoter pledging?
Not automatically. Small, stable, well-explained pledges are common and often relate to routine group financing. What matters is direction, purpose and size on both denominators. Rising pledge while the share price falls is the dangerous pattern, because it usually means the lender is demanding more collateral. Pledge above roughly a quarter of promoter holding deserves a clear explanation from management. Treat pledging as a reason to size your position smaller, not as a standalone verdict.
Related Blogs
How to Analyse a Stock Before Buying: A 10-Point Checklist
Published: Mon Sep 07 2026Read more…

How to Calculate Your Financial Freedom Number and Achieve It
Published: Tue May 20 2025Read more…
 (1).jpg)
From Signal to Strategy: The Moving Averages
Published: Tue May 20 2025Read more…

Market Share: The Silent Signal of Competitive Power and Investment Opportunity
Published: Wed May 14 2025Read more…