How do I screen stocks using a stock screener?
Most people open a screener, click ten filters, get 400 names and give up. This page shows the order to apply filters in, what numbers to type, how many Indian companies actually clear a basic quality bar, and what to check after the screen finishes.

BOSSINVESTOR
Mon Sep 07 2026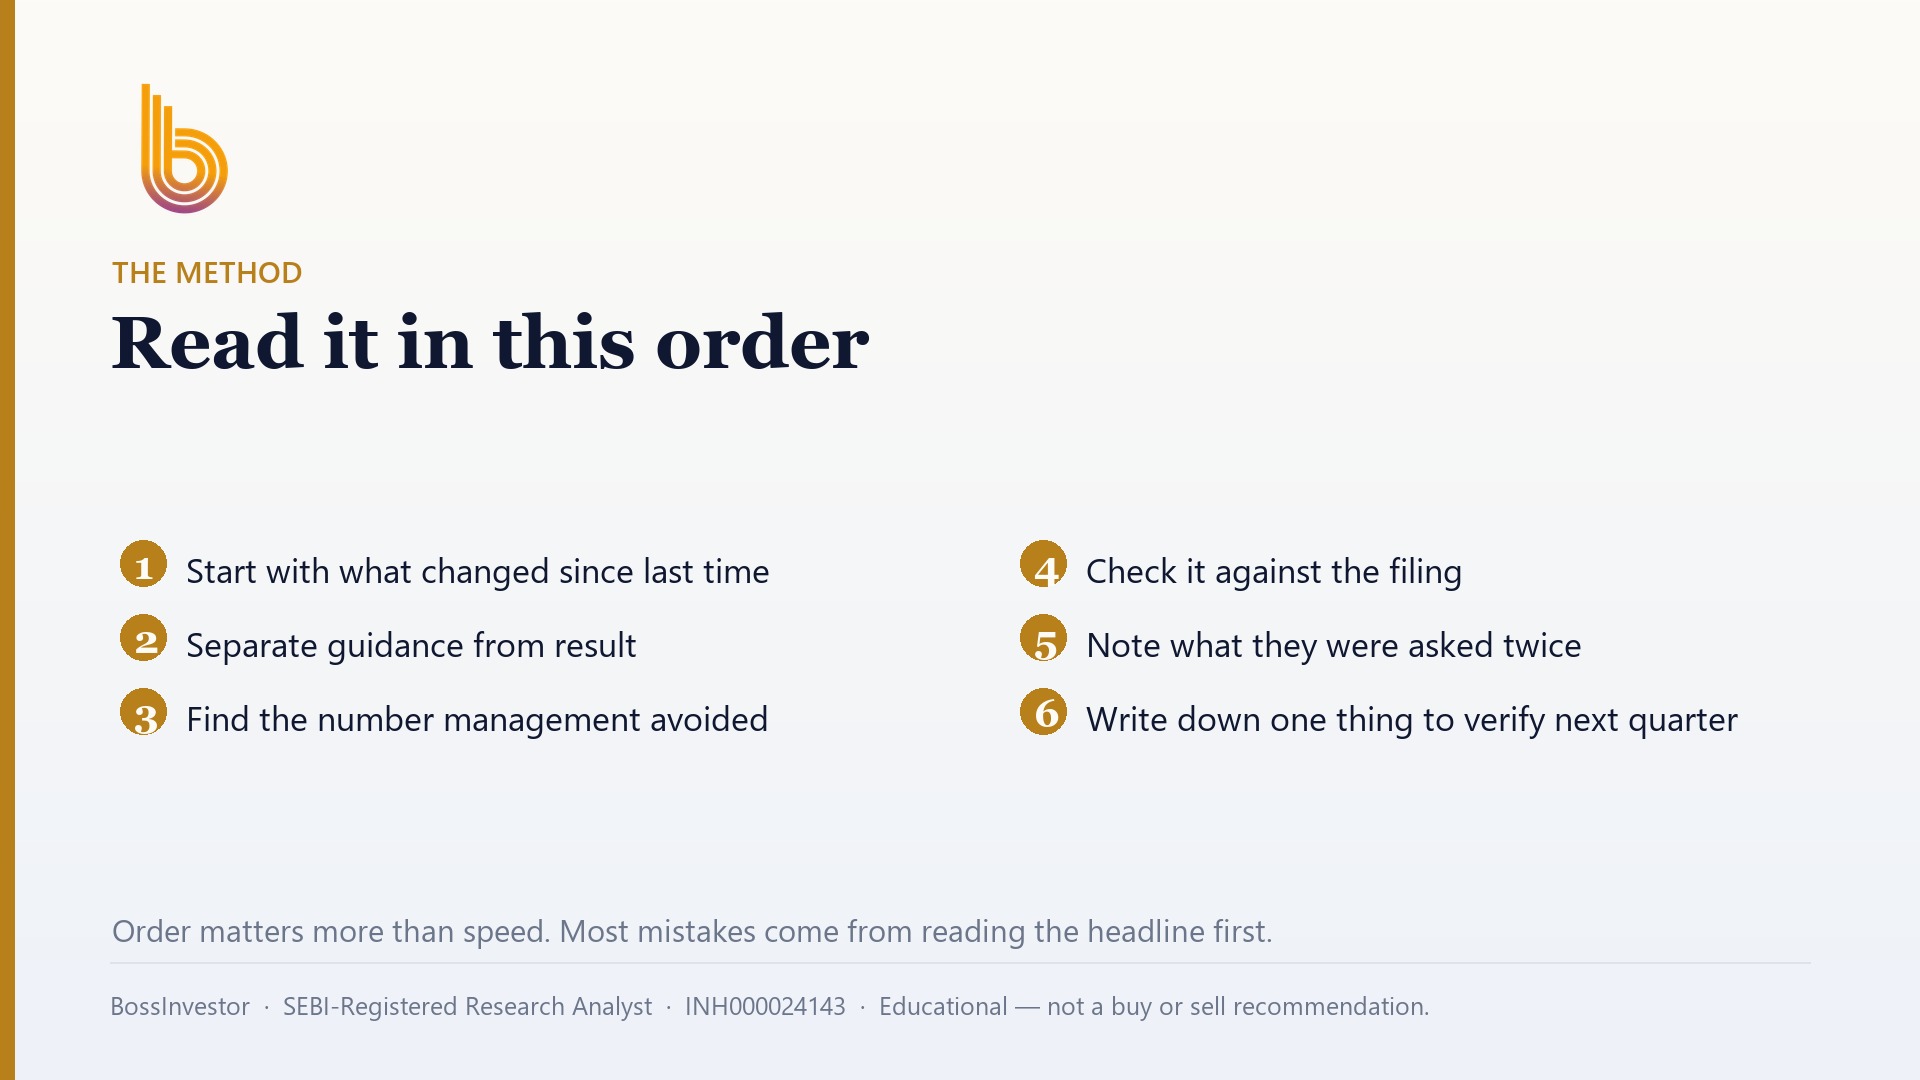
What is the right way to run a stock screen on Indian listed companies?
Screen stocks in three layers: quality (ROE and ROCE above 15%), safety (debt-to-equity below 1), then price (PE under 40). Apply them together, not one at a time. Add a market-cap floor to remove illiquid names. The screener gives you a shortlist to research, never a buy list.
Key Takeaways
- A screener removes companies; it never selects one for you.
- Order matters: quality first, debt second, valuation last.
- As of August 2026, only 22.0% of 1,518 Indian companies with full-year fundamentals clear ROE >15%, ROCE >15% and debt-to-equity <1 together.
- Adding a PE-under-40 filter cuts that to 15.9%.
- Never apply a flat debt-to-equity rule to banks and NBFCs.
- Every screened name still needs a manual read of the annual report before you risk rupees.
What does a stock screener actually do?
A stock screener is a filter on a list. Thousands of companies are listed on the NSE and BSE. You write rules like 'return on equity above 15 per cent' and the screener hands back only the companies that satisfy the rule. That is the whole mechanism. It is a sieve, not an adviser.
This matters because most retail losses start with the opposite habit: you hear a name on a WhatsApp group, then hunt for reasons to justify it. A screener flips the order. You decide what a good business looks like in the abstract, write those conditions down as numbers, and only then see which companies come out. The names arrive after the standard, not before it.
Free screeners are everywhere, including broker terminals and standalone websites that pull filings from the exchanges. They differ in interface and in how quickly they update after results season, but the logic is identical everywhere: choose a metric, choose an operator (greater than, less than, between), type a number, and combine conditions with AND. Output is a starting list. Nothing more.
Which filters should a beginner start with?
Use three buckets, in this order: quality, safety, price. Four filters total. Resist the urge to add a fifteenth.
Quality asks whether the business earns well on the money inside it. Return on equity (ROE) tells you what the company earned on shareholders' money. Return on capital employed (ROCE) tells you what it earned on all the money in the business, including borrowed money. A company can flatter its ROE by borrowing heavily, so ROCE is the honest cousin. Use both together and that trick stops working.
Safety asks whether debt can kill the company in a bad year. Debt-to-equity compares borrowings against shareholders' funds. A number below 1 means the company owes less than its own capital base.
Price asks what you are paying for those earnings. The price-to-earnings ratio (PE) is the share price divided by earnings per share. It is the crudest possible valuation measure and it is still the right one to start with, because it is comparable, universally reported, and hard to fudge across a whole market.
Quality first, then safety, then price. If you screen on cheapness first, you will spend your evenings reading about companies that are cheap for excellent reasons.
What numbers should I actually type into each filter?
Start here: ROE greater than 15%, ROCE greater than 15%, debt-to-equity less than 1, and PE between 0 and 40. Also set a market capitalisation floor — somewhere around ₹500 crore is a common starting point — so you do not end up with names where a single order moves the price 8 per cent and you cannot exit.
The reason PE starts at 0 rather than having no lower bound is subtle and important. A loss-making company produces a negative PE. If your filter reads 'PE less than 40', every loss-maker in the market sails through, because minus 12 is less than 40. Bounding the range from 0 to 40 quietly removes companies with no profits at all.
An illustrative example of what these numbers mean in rupees: a company with ₹100 crore of net profit sitting on ₹500 crore of shareholders' funds has an ROE of 20 per cent. If it also carries ₹300 crore of borrowings against that ₹500 crore of equity, its debt-to-equity is 0.6. Both figures here are illustrative and invented to show the arithmetic, not drawn from any real company.
These thresholds are conventions, not laws. Fifteen per cent is a widely used bar because it comfortably beats what a fixed deposit pays and roughly reflects what a genuinely good Indian business sustains over a cycle. You can move the numbers. What you cannot do is move them after seeing the results, to make a stock you already like reappear.
How many Indian companies actually pass a basic quality screen?
Far fewer than people expect, and this is the single most useful thing to know before you start. From our own universe of 1,852 listed Indian companies, 1,518 had full-year fundamentals available as of August 2026. Of those 1,518, just 22.0% (334 companies) cleared all three quality and safety conditions at the same time: ROE above 15%, ROCE above 15%, and debt-to-equity below 1.
Add the valuation check — PE under 40 — and the list shrinks again to 15.9% (241 companies), as of August 2026. So roughly six out of every seven listed companies with reported fundamentals fail a bar that most investors would describe as merely reasonable.
The individual filters are much softer than the combination. Taken one at a time as of August 2026, 30.2% cleared ROE above 15%, 30.6% cleared ROCE above 15%, 84.5% had debt-to-equity below 1, and 65.1% traded at a PE between 0 and 40. Any single filter leaves you with hundreds of names. It is stacking them that does the work.
One more anchor for judging price: the median PE across our universe was 24.0 as of August 2026. That is the middle of the market. If a company you are looking at trades far above that, you are not necessarily wrong — but you are paying up, and you should be able to say out loud what you are paying up for.
Why does my screen return 400 names, or nothing at all?
Both outcomes mean the same thing: your filters are not doing their job. Four hundred names means the conditions are so loose that half the market qualifies. Zero names usually means you have stacked six or seven conditions, each individually sensible, that no real company satisfies simultaneously.
The fix is to aim for a workable shortlist — somewhere between fifteen and forty names is a sane target for one person to research over a few weekends. Get there by tightening one filter at a time and watching the count move. If raising the ROE bar from 15% to 18% takes you from 300 names to 90, that filter is doing real work. If it changes nothing, drop it and use a different one.
The failure mode to avoid is loosening a filter until a company you already had in mind shows up. That is not screening. That is writing the answer at the bottom of the page and then constructing the sum. If a favourite name does not pass your own standard, the honest response is to either change the standard for every company or leave the name alone.
Which filters give misleading results for banks and NBFCs?
Debt-to-equity, badly. A bank or an NBFC borrows money and lends it out at a higher rate. Borrowing is the product, not a warning sign. Applying a flat debt-to-equity below 1 rule to a lender will eliminate almost the entire financial sector from your list, including the strong ones, for reasons that have nothing to do with risk. In our own numbers above, that same rule is doing exactly this in the background.
So run financials as a separate screen with different filters. For lenders, investors typically look at capital adequacy, gross and net non-performing assets, provision coverage, and net interest margin instead. The principle carries: you are still asking whether the business earns well and whether it can survive a bad year. You are just asking with the right instruments.
The same caution applies more mildly elsewhere. Holding companies, real estate developers with project-level debt, and utilities with regulated returns all have structural reasons for figures that look odd against a generic screen. Screening is only as good as the assumption that companies in the list are comparable. When that assumption breaks, segment the universe before you filter it.
What should I check on a company after it clears my screen?
The screen tells you what a company reported. It cannot tell you whether the reported numbers are trustworthy or repeatable. That is your job, and it is done by reading, not filtering.
Open the latest annual report and the last four quarterly filings on the company's investor relations page or the exchange site. Look for four things. First, does operating cash flow roughly track reported profit over several years? Profit that never turns into cash is the most common early signal of trouble. Second, is the profit growth from the core business, or from a one-off — an asset sale, a tax writeback, an insurance receipt? A single fat year can push a mediocre company through a five-year screen. Third, check promoter shareholding and whether promoter shares are pledged; heavy pledging is a stress signal. Fourth, read the auditor's report and the related-party transactions note, dull as they are.
Then ask the question no screener can answer: what does this company actually sell, to whom, and why would that continue for the next five years? If you cannot explain the business to a friend in three sentences, the ratios do not rescue you.
What mistakes make a screen useless?
Screening on a single year is the biggest one. One good year happens to bad companies regularly. Wherever your screener allows it, use three-year or five-year averages for ROE and ROCE, and glance at the year-by-year figures rather than the average alone. A company that did 5%, 6%, 40% averages a respectable 17%, and that 40% is almost certainly a one-off.
Screening on price movement is the second. Filters like 'up 50% in six months' or 'near 52-week high' feel like momentum but for most retail investors they simply select whatever is already crowded and expensive. If you want to use price, use it as the last cross-check, not the first cut.
Third: too many filters. Every additional condition narrows the list, and past a point it narrows it arbitrarily rather than intelligently. Four to six well-chosen filters beat twelve.
Fourth: forgetting that screener data comes with a lag and occasional errors. Databases mis-map consolidated and standalone accounts, miss a restated figure, or lag a results announcement by weeks. Before you act on any name, verify the two or three numbers that mattered most against the company's own filing. It takes ten minutes and it will save you at least once.
How often should I re-run my screen, and does trading it cost me?
Once a quarter, after results season has settled, is enough for a fundamental screen. The inputs are annual and quarterly financials; they do not change on Tuesdays. Re-running daily just tempts you to trade on noise.
When you re-run, expect churn — companies drop out because a weak quarter pulled the ROE below your bar, or because the price ran up and the PE crossed 40. A name leaving the list is information, not an instruction. Ask why it left before you do anything.
Trading that churn is not free in India. Every sale carries brokerage, STT, exchange and SEBI charges, GST on brokerage and stamp duty, and the bid-ask spread on top. Then there is tax: shares sold within a year are taxed as short-term capital gains, at a materially heavier rate than long-term gains on shares held beyond a year. A screen that flips your portfolio every quarter can quietly hand a real share of your returns to costs and the tax department. Let the screen refresh your watchlist frequently and your holdings rarely.
Click Here – See BossInvestor's Data-Driven Stock Screens
Conclusion
Screening is a discipline, not a shortcut: write down what a good business looks like as numbers, apply quality and safety filters before valuation, and treat the output as a reading list rather than a buy list. The August 2026 figures are the useful reality check — only 22.0% of 1,518 companies with full-year fundamentals clear a basic quality bar, and 15.9% clear it at a sensible price, so a shortlist of twenty is normal, not thin. Build the screen yourself and you will at least understand why every name is on it. If you want the research work on specific names already done, that sits behind KYC in the BossInvestor app.
BossInvestor is a SEBI Registered Research Analyst (INH000024143). This article is for educational and informational purposes only. It explains a method and is not investment advice, nor a recommendation to buy, sell or hold any security. Market-wide figures are computed from our universe as of August 2026; past metrics do not guarantee future results. Always do your own research or consult a registered adviser before investing.
Frequently Asked Questions
Is a free stock screener good enough, or do I need a paid one?
A free screener is good enough to build your shortlist. The underlying data is the same exchange and filing data everyone uses. Paid tools mainly buy you convenience: faster updates after results, longer history, custom formulas, saved screens and alerts. None of that changes the quality of your thinking. Start free, learn which filters actually move your list, and pay only when a specific limitation is genuinely blocking you. Always verify key figures against the company's own filing regardless of what you use.
What is a reasonable PE to use as a filter for Indian stocks?
A range of 0 to 40 is a workable starting filter — the lower bound of zero matters because it removes loss-making companies that would otherwise slip through with negative PE values. For context, the median PE across our universe of Indian listed companies was 24.0 as of August 2026. Treat PE as a rough sorting tool, not a verdict. A low PE can signal a declining business, and a high one can be justified by growth. Use it to narrow, then investigate.
Why do banks and NBFCs disappear from my screen?
Almost certainly your debt-to-equity filter. Lenders borrow money to lend it onward, so high borrowings are their business model rather than a weakness. A flat rule like debt-to-equity below 1 removes nearly the whole financial sector regardless of quality. Screen financials separately using measures built for them: capital adequacy, gross and net NPAs, provision coverage and net interest margin. Same underlying questions — does it earn well, can it survive a bad year — asked with instruments that fit the business.
How many stocks should my screen return before I stop tightening it?
Aim for roughly fifteen to forty names. That is enough to give you choice and few enough that one person can genuinely read the filings over a few weekends. If you are seeing hundreds, your filters are too loose; tighten one at a time and watch which condition actually moves the count. If you get zero, you have stacked too many conditions and should relax the least important one. Never loosen a filter specifically to make a stock you already like reappear.
Can I buy a stock straight off the screener output?
No. A screener confirms that reported numbers cleared your thresholds. It cannot tell you whether those numbers are reliable, repeatable, or driven by a one-off event. Before risking money, read the annual report, compare operating cash flow against reported profit across several years, check promoter shareholding and pledging, scan the auditor's report and related-party notes, and be able to explain what the company sells and to whom. The screen narrows the field; the reading decides.
Related Blogs
How to Analyse a Stock Before Buying: A 10-Point Checklist
Published: Mon Sep 07 2026Read more…

How to Calculate Your Financial Freedom Number and Achieve It
Published: Tue May 20 2025Read more…
 (1).jpg)
From Signal to Strategy: The Moving Averages
Published: Tue May 20 2025Read more…

Market Share: The Silent Signal of Competitive Power and Investment Opportunity
Published: Wed May 14 2025Read more…