How to value a stock and estimate its intrinsic value
Most investors buy a price and hope. This page shows you how to work out what a business is actually worth, using cash flows, a discount rate and a margin of safety. Plain language, Indian examples, and the screening numbers from our own universe of listed companies.

BOSSINVESTOR
Mon Sep 07 2026
What is the simplest way to work out what a share is really worth?
Intrinsic value is the present value of the cash a business will hand its owners over its life. Estimate it by forecasting free cash flow for five to ten years, discounting it back at the annual return you demand, adding a terminal value, subtracting net debt, then dividing by shares outstanding. Buy only at a discount to that number.
Key Takeaways
- Intrinsic value is a range, not a single rupee figure — anyone quoting an exact price is selling confidence.
- Start with free cash flow, not reported profit; profit can be flattered, cash usually cannot.
- Your discount rate is the return you demand — never lower it to justify a stock you already like.
- Of 1,518 Indian companies with full-year fundamentals, only 22.0% clear ROE above 15%, ROCE above 15% and debt-to-equity below 1 together (August 2026).
- Adding a PE-under-40 check leaves 15.9% — roughly one listed company in six is both decent and not obviously expensive.
- Demand a 20-30% margin of safety on stable businesses, and much more on cyclicals.
What does intrinsic value actually mean?
Intrinsic value is what a business is worth based on the cash it will hand its owners over its life — not what the screen says today. Market price is an opinion that changes every second. Intrinsic value is an estimate that changes slowly, because a factory, a brand, a distribution network and a management team do not change every second. When you buy a share on the NSE or BSE, you are buying a small slice of that cash-generating machine. Your job is to estimate the size of the machine's future cash, then work out what that estimate is worth today.
Two things follow. First, intrinsic value is a range, never a single rupee figure. Anyone who tells you a stock is worth exactly ₹847 is selling confidence, not analysis. Second, the answer depends entirely on assumptions you choose — growth, margins, and the return you demand. Change one assumption slightly and the answer moves a lot. That is not a flaw in the method. It is the method honestly telling you how uncertain the future is. Good valuation is less about precision and more about knowing which single assumption is doing the heavy lifting in your answer.
How do I estimate the intrinsic value of a stock step by step?
Five steps. One, understand how the company actually makes money — what it sells, to whom, and why customers keep coming back. Two, check whether the business is good enough to be worth valuing at all: returns on capital, debt levels, and whether profit turns into cash. Three, forecast what the business earns in cash over the next several years. Four, discount those future rupees back to today, because a rupee in 2033 is worth less than a rupee now. Five, compare your answer with the market price and insist on a gap in your favour before you act.
Most retail investors skip straight to step four with a spreadsheet, which is why the answers feel fake. The spreadsheet is the easy part. The hard part is steps one and two — knowing the business well enough that your growth number is a considered judgement rather than a figure copied from last year's headline. If you cannot explain in three sentences how this company will still be making money ten years from now, no amount of careful discounting will rescue the exercise. Close the file and look at the next company. There are thousands of them listed in India.
How do I forecast future cash flows without pretending to know the future?
Start with owner earnings, not reported profit. Take operating cash flow from the cash flow statement and subtract the capital expenditure the company needs simply to stay where it is. What is left is the cash genuinely available to owners. Reported net profit can be flattered by one-off gains, capitalised expenses, or receivables that never turn into cash. Indian companies file quarterly and annual results with the exchanges, so read at least five years of them. You want to see how cash behaves through a bad year, not only through the year the company likes to advertise.
For the forecast itself, be boring. Take the last five to ten years of revenue growth, strip out the outlier years, and ask what this company can realistically do given the size of its market in India. A company doing ₹500 crore of revenue in a growing category can compound quickly. One already doing ₹50,000 crore in a mature category cannot compound at that rate forever. So assume growth fades over time. Nothing in India grows at 25% for twenty years. Build three cases — poor, likely, good — and look honestly at how wide the resulting range is.
What discount rate should an Indian investor use?
The discount rate is simply the annual return you demand for taking the risk of owning equity instead of something safe. Start from what a government bond pays you for taking almost no risk, then add a premium for the fact that a share can halve. In India that usually lands investors somewhere in the low-to-mid teens for a stable, cash-generating business, and higher for a smaller, cyclical or heavily borrowed one. There is no officially correct number. What matters is using the same logic for every company, so your comparisons stay honest.
Two practical rules. Do not quietly lower the discount rate to make a favourite company look cheap — that is the most common act of self-deception in valuation. And do not apply one comfortable rate to a genuinely risky business; if earnings swing with commodity prices or depend on a single large customer, demand more. Remember also that your return is taxed when you finally sell, and dividends are taxed in your hands at your slab rate. The return you actually keep is lower than the return on the screen, so build your demand accordingly.
Can you show a simple discounted cash flow with actual numbers?
Yes, using entirely illustrative figures that describe no real company. Suppose a business generates ₹100 crore of free cash flow this year. Assume it grows 10% a year for five years, then 5% a year forever after that, and that you demand a 12% annual return. Years one to five produce roughly ₹110, ₹121, ₹133, ₹146 and ₹161 crore. Discounting each back at 12% gives approximately ₹98, ₹96, ₹95, ₹93 and ₹91 crore. Added up, the first five years are worth about ₹474 crore in today's money. That is the easy half of the calculation.
Now the value of everything after year five. Take ₹161 crore growing at 5%, so about ₹169 crore, divided by 12% minus 5%, which gives roughly ₹2,414 crore in year-five money. Discounted back at 12%, that is about ₹1,370 crore today. Add the two halves and the whole business is worth roughly ₹1,844 crore. If it carries ₹200 crore of net debt, the equity is worth about ₹1,644 crore, or roughly ₹164 per share across 10 crore shares. Change the forever-growth figure from 5% to 4% and the per-share answer falls by more than 10%. That sensitivity is the real lesson here.
When should I use PE or EV/EBITDA instead of a full DCF?
A discounted cash flow works best where cash flows are predictable — consumer goods, pharma, IT services, established branded businesses. It works badly for cyclicals, early-stage companies and lenders. For those, comparison-based valuation is more honest. PE compares price with earnings. EV/EBITDA brings debt into the picture, which matters for capital-heavy businesses. Price-to-book is the workhorse for banks and NBFCs, usually read alongside return on equity. Running a standard free-cash-flow DCF on a lender is close to meaningless, because borrowing and lending are the operations themselves, not financing around them.
The trap with multiples is treating them as valuation when they are only comparison. A PE of 15 is not cheap if profits are about to fall, and a PE of 45 is not expensive if the company genuinely compounds earnings for a decade. Across our universe as of August 2026, the median PE is 24.0 — a useful reference point, not a rule. Always ask what the multiple is quietly assuming about future growth, then ask whether that assumption is plausible for this specific company, in this specific industry, in India, over the next several years.
How do I check the quality of a business before valuing it?
Valuation without a quality check is careful arithmetic on a bad idea. Three simple filters do most of the work: return on equity above 15%, return on capital employed above 15%, and debt-to-equity below 1. The first two tell you the company earns well on the money it uses. The third tells you it is not surviving on borrowed time. In our universe of 1,852 listed Indian companies as of August 2026, 1,518 had full-year fundamentals. Of those, 458 (30.2%) cleared ROE above 15%, 464 (30.6%) cleared ROCE above 15%, and 1,282 (84.5%) had debt-to-equity below 1.
The interesting number is the overlap. Only 334 companies — 22.0% — cleared all three at the same time. Add a valuation check of PE under 40 and just 241 companies, 15.9%, survive. So roughly one listed Indian company in six is both decent and not obviously expensive. That is the true size of your hunting ground, and it explains why patience beats activity. One important caveat: a flat debt-to-equity rule unfairly punishes banks and NBFCs, because borrowing is their business model. Judge lenders instead on capital adequacy, asset quality, provisioning and return on equity.
How big a margin of safety do I need before buying?
Your intrinsic value estimate will be wrong. The margin of safety is the discount you insist on so that being wrong still leaves you unhurt. For a stable business you genuinely understand, a gap of 20-30% between your estimated value and the market price is a reasonable ask. For a cyclical business, or a company with a short track record, demand considerably more. And if the market price already sits above your best-case value, there is nothing left to think about — the price is doing all the hoping on your behalf.
Practically, this means writing your value range down before you look at the price, not after. Anchoring on the current quote and then reverse-engineering assumptions to justify it is the most common way retail investors lose money while feeling analytical. Keep a one-page note for each company: your assumptions, your range, and the date you wrote it. Revisit it when quarterly results arrive. If the business has changed, change your value. If only the price has changed, do nothing at all. That discipline is worth more than any refinement to your model.
What are the most common mistakes when estimating intrinsic value?
Four repeat endlessly. Extrapolating one exceptional year forever. Choosing a discount rate low enough to produce the answer you already wanted. Letting terminal value — the part after your forecast ends — swell to 80% or more of the total, which means you are really valuing a guess about the 2040s. And ignoring dilution: if the share count keeps rising through fresh issues or generous stock options, per-share value falls even while the business itself grows. Each of these feels like a small liberty at the time and each one quietly doubles your answer.
Add a fifth: valuing the parent company when the profits actually sit in subsidiaries, or the reverse. Read the consolidated statements, check related-party transactions, check pledged promoter shares, and check whether cash flow follows reported profit year after year. Most poor Indian investment outcomes are not valuation errors at all. They are governance errors that a careful reading of the annual report would have flagged long before anyone opened a spreadsheet. The model is only as good as the accounts feeding it, and the accounts deserve your suspicion first.
Click Here – See BossInvestor's Data-Driven Stock Screens
Conclusion
Valuation is not a way to predict a price. It is a way to decide whether today's price is asking you to believe something reasonable or something absurd. Get the business right, keep your assumptions conservative, insist on a discount, and write your reasoning down before you look at the quote. If you would rather see this method applied to specific companies with the research behind it, that work sits inside the BossInvestor app after KYC.
BossInvestor is a SEBI Registered Research Analyst (INH000024143). This article is for educational and informational purposes only. It explains a method and is not investment advice, nor a recommendation to buy, sell or hold any security. Market-wide figures are computed from our universe as of August 2026; past metrics do not guarantee future results. Always do your own research or consult a registered adviser before investing.
Frequently Asked Questions
Is intrinsic value the same as book value?
No. Book value is an accounting figure — assets minus liabilities, based on historical cost. Intrinsic value is forward-looking: the present value of the cash the business will generate from here. A strong brand or distribution network barely shows up in book value but drives most of the intrinsic value. For banks and NBFCs, book value is more useful because their assets are financial, which is why price-to-book is the standard measure there rather than a cash flow model.
How often should I re-estimate a company's intrinsic value?
Once a year after the annual report, plus whenever something genuinely changes the business — a major acquisition, a capacity expansion, a regulatory shift, a change in management, or a run of quarters where cash stops following profit. Do not re-estimate simply because the price moved. Price movement is information about other investors' moods, not about the company's cash generation. Re-running the model every time the market drops 5% just converts anxiety into false activity.
Can I value a loss-making company?
You can, but the range will be very wide and largely driven by assumptions you cannot verify. You would forecast when losses turn to profits, what steady-state margins look like, and how much capital gets raised in between — each of which can dilute your stake heavily. If you attempt it, insist on a much larger margin of safety and size the position accordingly. For most retail investors, businesses that already generate cash are a far better use of limited research time.
Why do two analysts get very different intrinsic values for the same stock?
Because they chose different assumptions. A one percentage point change in the long-term growth rate or the discount rate can shift the answer by 20% or more, as the illustrative example above shows. That is normal and healthy. What matters is not whose number is bigger but whose assumptions are more defensible. When you read someone else's valuation, skip the conclusion and go straight to the growth rate, the discount rate and the terminal value share.
Does a low PE mean a stock is undervalued?
Not by itself. A low PE often means the market expects earnings to fall, and it is frequently right. Across our universe as of August 2026, the median PE is 24.0, but a company below that median can still be expensive if profits are peaking, and one above it can be reasonable if returns on capital are high and durable. Use PE as a starting question — why is this priced here? — not as a verdict on value.
Related Blogs
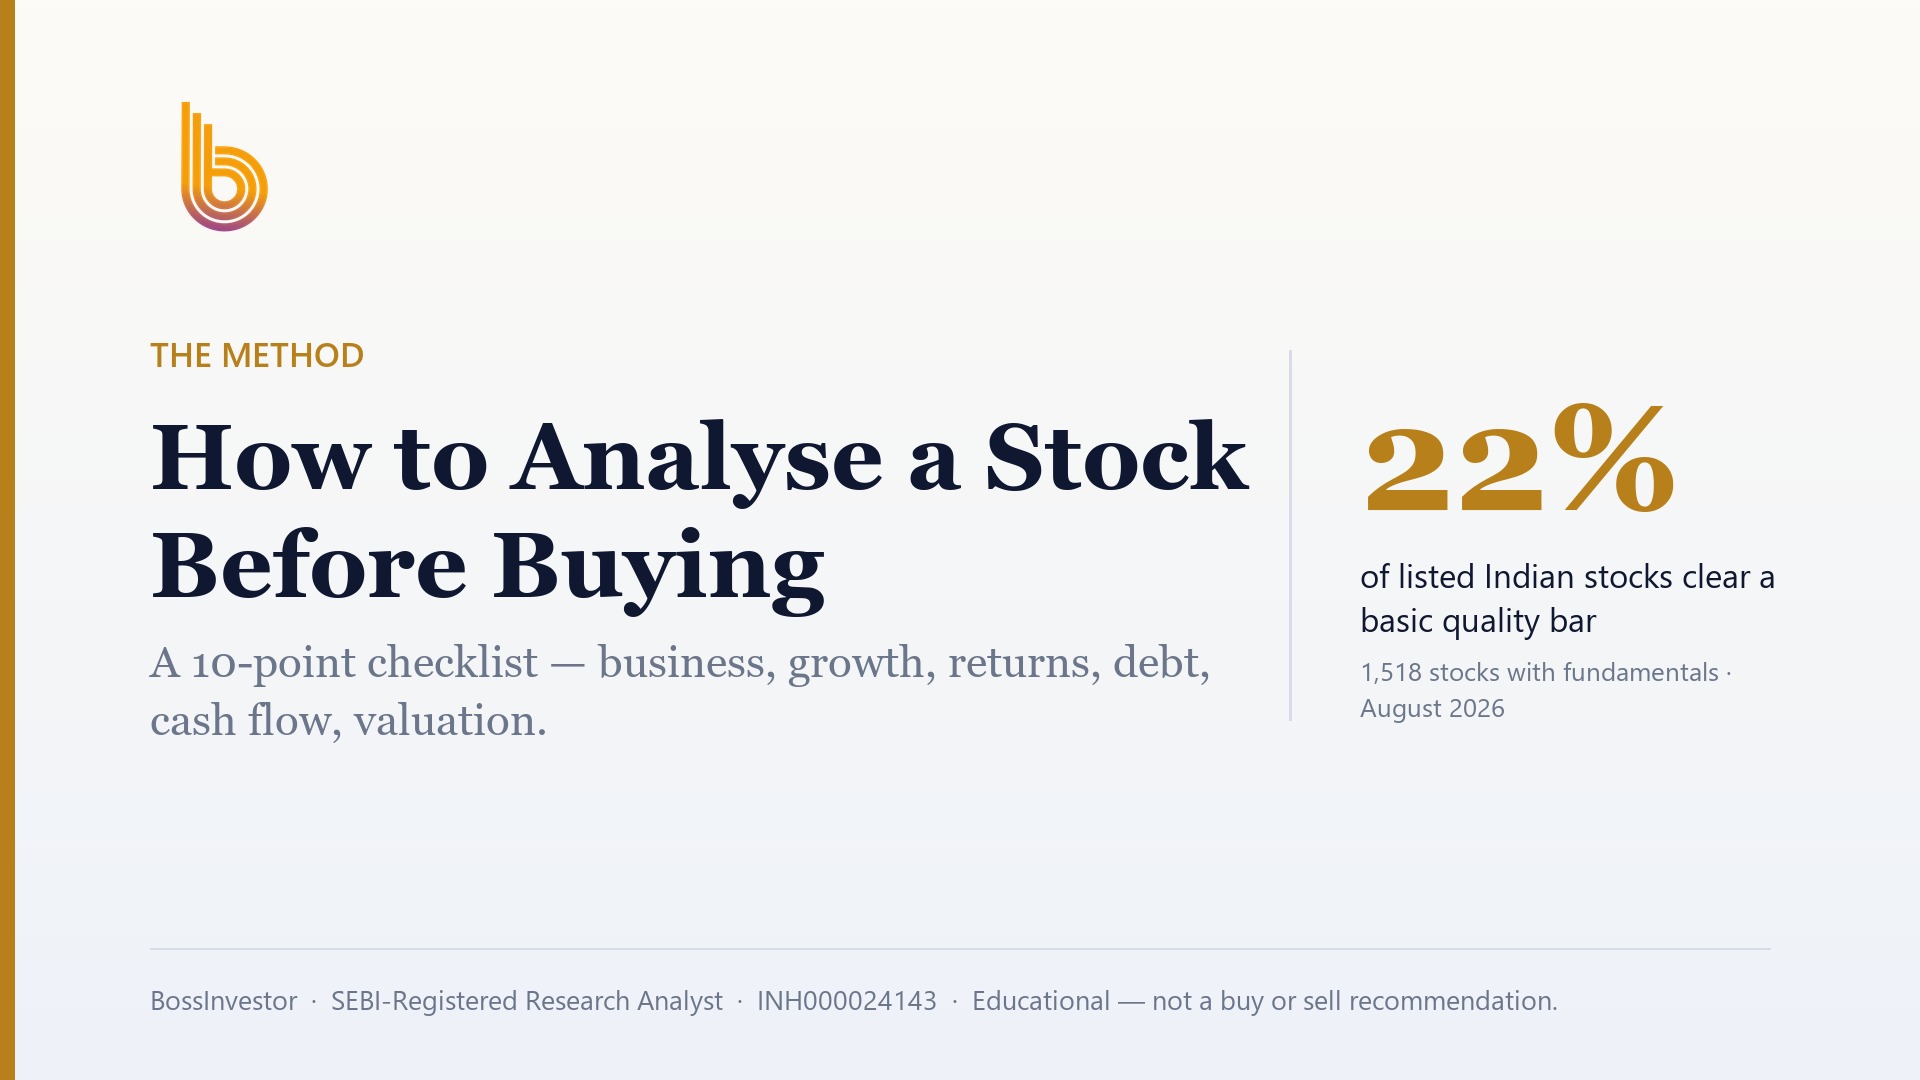
How to Analyse a Stock Before Buying: A 10-Point Checklist
Published: Mon Sep 07 2026Read more…

How to Calculate Your Financial Freedom Number and Achieve It
Published: Tue May 20 2025Read more…
 (1).jpg)
From Signal to Strategy: The Moving Averages
Published: Tue May 20 2025Read more…

Market Share: The Silent Signal of Competitive Power and Investment Opportunity
Published: Wed May 14 2025Read more…