How to know if a stock is overvalued or undervalued
Most investors judge a stock by its price tag on the NSE screen. That number tells you nothing. This page walks through the exact checks — PE, book value, cash flow, growth, return on capital — that tell you whether you are paying a fair price or an inflated one, using plain language and Indian examples.

BOSSINVESTOR
Mon Sep 07 2026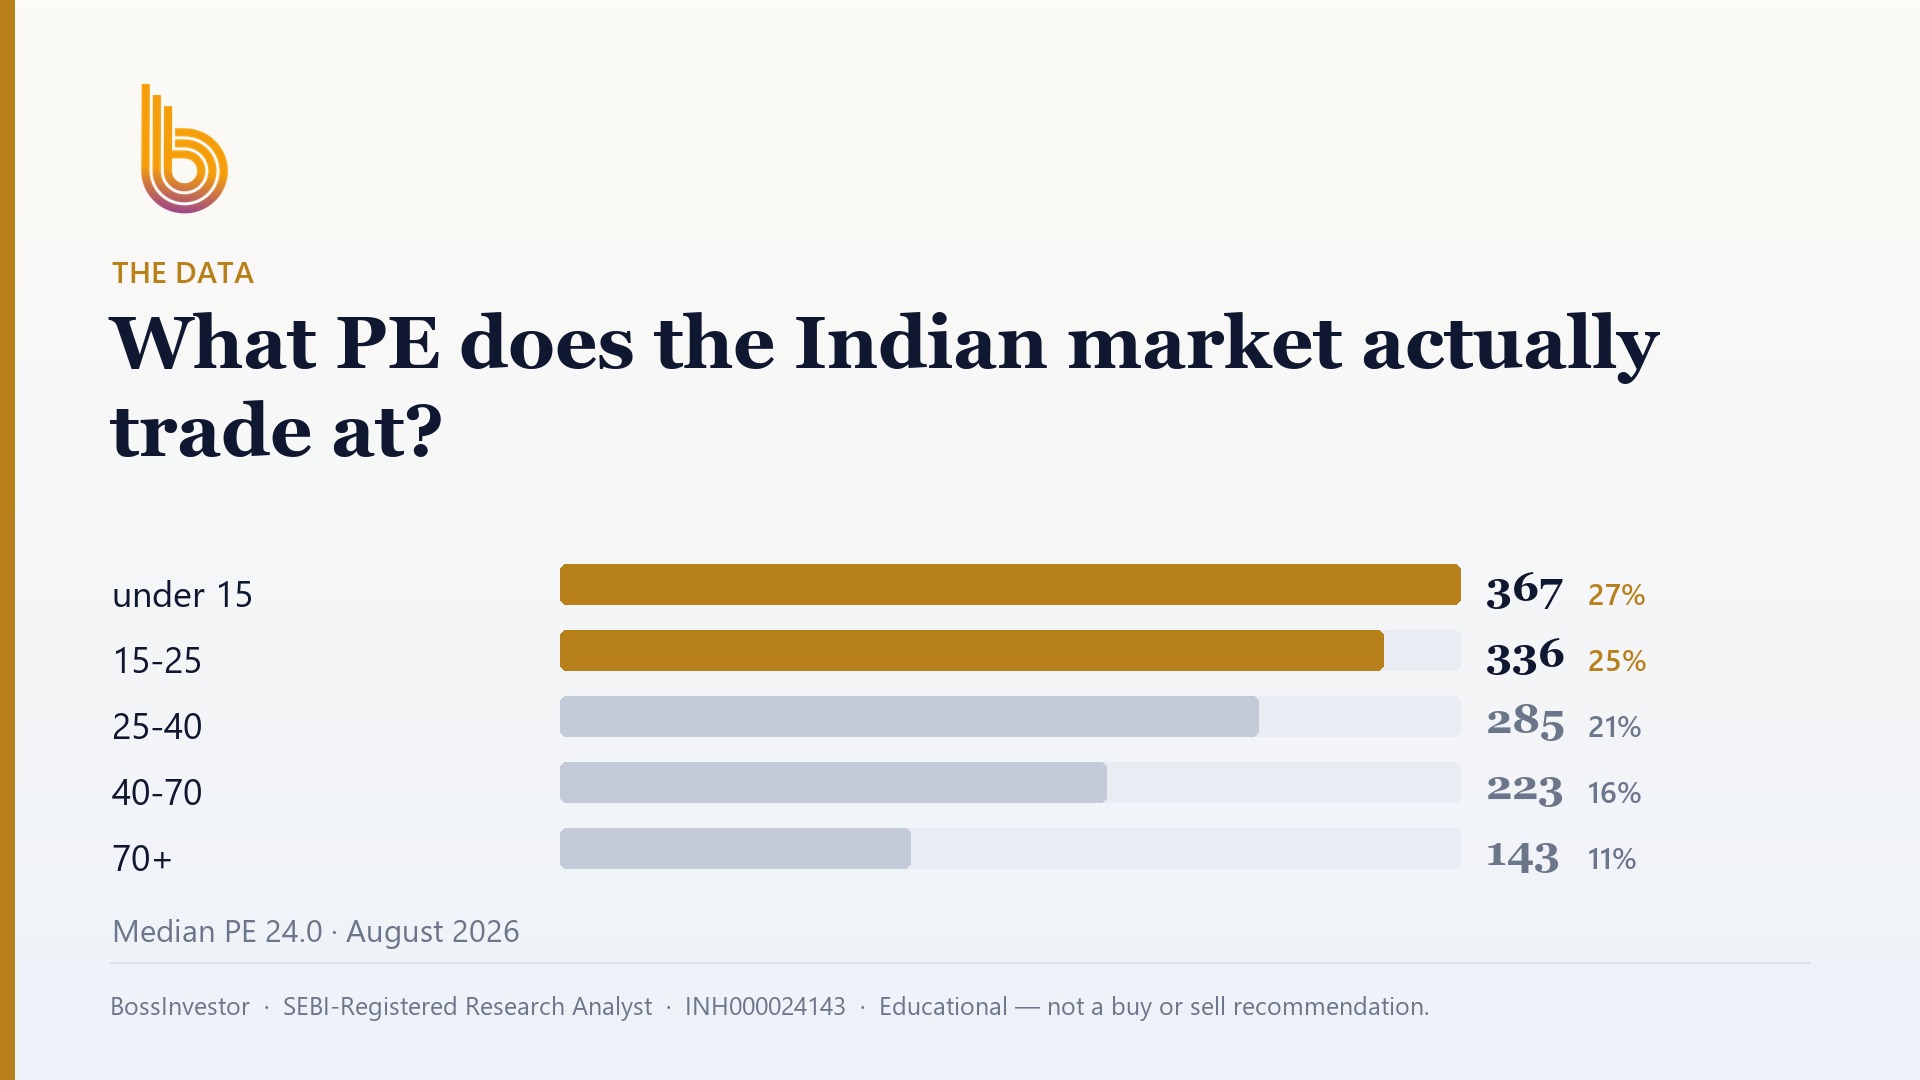
How do you actually tell whether an Indian stock is expensive or cheap right now?
Compare the stock's price to what the business actually earns and owns. Check PE, price-to-book and cash flow against the company's own ten-year history and its sector peers, then ask whether growth and return on capital justify the gap. Cheap plus deteriorating is a trap, not a bargain.
Key Takeaways
- Share price alone means nothing — a ₹3,000 stock can be cheaper than a ₹18 stock.
- Always compare a stock's PE to its own history and its sector, never to the market average alone.
- Median PE across our universe of Indian stocks with full-year fundamentals was 24.0 as of August 2026.
- A high PE is only justified if profit growth and return on capital are genuinely high.
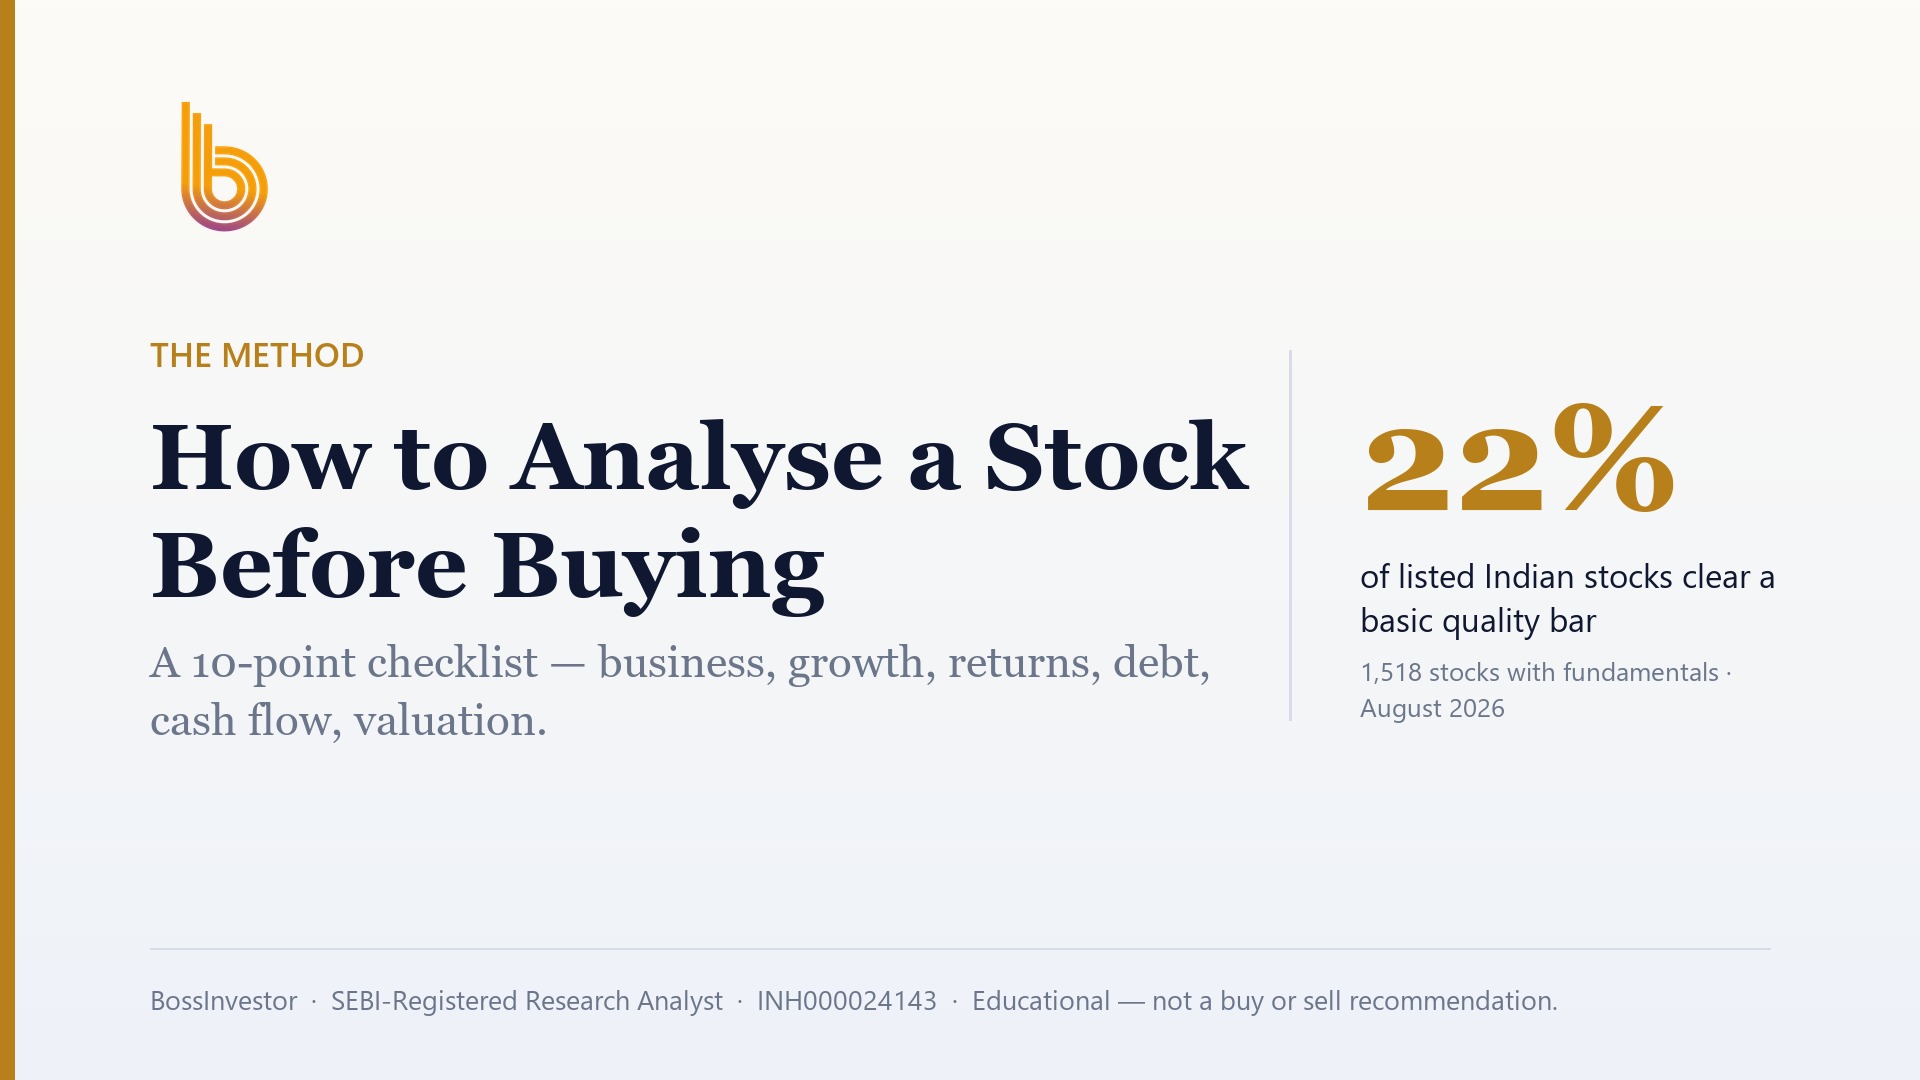
- Only 22.0% of 1,518 Indian companies cleared a basic quality bar as of August 2026 — quality is rarer than it looks.
- Banks and NBFCs need different maths; a flat debt rule wrongly flags them as risky.
What does it actually mean for a stock to be overvalued?
A share is a slice of a business. Overvalued means today's price already assumes more profit than the business is realistically going to deliver. Undervalued means the price assumes less than the business will probably deliver. That is the whole idea. Everything else is just arithmetic to test it.
The number blinking on your NSE or BSE screen is a price, not a value. It is simply what the last buyer and the last seller agreed on, in that second, for whatever reason. Value comes from the cash the business will earn for its owners over the next five, ten, twenty years. Price and value drift apart all the time. That gap is the only thing you are looking for.
This is why the price tag by itself is meaningless. A ₹3,000 share can be genuinely cheap and a ₹18 share can be wildly expensive. Until you divide the price by something the business produces — earnings, book value, cash — you are not valuing anything. You are just looking at a number. Anchoring to the price tag is the single most expensive habit in Indian retail investing, and almost everyone starts there.
How do I use the PE ratio to check if a stock is expensive?
PE is price divided by earnings per share. If a company earns ₹10 per share and trades at ₹240, the PE is 24. Read it as: you are paying twenty-four rupees for every one rupee of annual profit. Lower is cheaper, higher is dearer — but only when you compare like with like.
For context, across our own universe of 1,852 listed Indian stocks, 1,518 had full-year fundamentals as of August 2026, and the median PE was 24.0. Also as of August 2026, 65.1% of them traded at a PE between 0 and 40. So a PE of 24 is ordinary. A PE of 70 is not automatically wrong, but it means the market is expecting something unusual, and you should be able to say out loud what that something is.
Do three comparisons, in this order. First, compare the stock's PE to its own average over the last five to ten years — if it normally trades at 22 and it is at 45 today, something has changed and you need to know what. Second, compare it to three or four direct competitors on the same exchange. Third, only then compare it to the broad market. Also check whether you are reading standalone or consolidated earnings; for a company with subsidiaries, consolidated is the honest number.
Which valuation numbers should I check besides PE?
PE breaks in several situations, so never rely on it alone. It becomes meaningless when profits are near zero or negative, when a one-time gain such as a land sale inflates the year's earnings, or when the business is cyclical and profits swing violently. In a cyclical company, the lowest PE often appears exactly at the top of the cycle, when profits are at their peak. That trap catches thousands of investors every cycle in metals, sugar and commodity chemicals.
Price-to-book compares the price to the net worth on the balance sheet. It is most useful for banks, NBFCs and asset-heavy businesses. Price-to-sales helps when a company is young or temporarily loss-making. EV/EBITDA — the whole business including its debt, compared to its operating profit — is useful when comparing two companies with very different borrowing levels, because PE quietly flatters a debt-loaded company.
The most underrated check is cash. Open the cash flow statement in the annual report and see whether reported profit is actually turning into cash from operations, year after year. A company that reports rising profit but never generates cash is telling you something the PE ratio cannot. Add dividend yield and free cash flow for mature businesses, where growth is slow and cash return is the real story.
Does a high PE always mean the stock is overvalued?
No. A high PE is a bill, and the question is whether the business can pay it. Two things justify paying up: durable profit growth, and high return on capital. A company growing profits at 20% a year with a return on capital of 25% deserves a far higher multiple than one growing 6% at a return of 11%. Compare PE against the growth rate — if a stock trades at 60 times earnings but grows at 10%, the market is very far ahead of the business.
Return on equity and return on capital employed tell you how efficiently the company turns money into profit. Above 15% on both is a reasonable starting bar in India. Here is how rare that is: as of August 2026, 30.2% of those 1,518 companies had ROE above 15%, and 30.6% had ROCE above 15%. When you demand ROE above 15%, ROCE above 15% and debt-to-equity below 1 at the same time, only 22.0% survive.
Now add valuation to quality. As of August 2026, applying a PE-under-40 filter on top of that quality bar leaves just 15.9% of the universe. That single number explains most of the frustration retail investors feel. Good businesses at sane prices are a minority, not the default. If you find twenty ideas in an afternoon, your bar is too low.
How should I value a bank or an NBFC differently?
Financial companies do not fit the usual template, and forcing them into it produces nonsense. As of August 2026, 84.5% of the 1,518 companies had debt-to-equity below 1 — but a flat debt-to-equity rule unfairly penalises banks and NBFCs, because borrowing money and lending it out at a higher rate is their entire business model. A bank with low leverage is not safe; it is barely operating. Exclude financials from any blanket debt screen.
For lenders, price-to-book is usually more informative than PE, read alongside return on assets and return on equity. Then look at asset quality: gross and net non-performing assets, provision coverage, and how the restructured book is trending. A lender trading below its book value is often the market saying it does not trust the stated value of the loans. Sometimes the market is wrong. Frequently it is not.
The same logic applies elsewhere. Insurance companies are judged on embedded value, real estate on the value of the land bank and pre-sales, and infrastructure on project cash flows and order books. Before you apply any ratio, ask what actually creates value in this industry. Using one formula everywhere is how confident-sounding investors get badly hurt.
How do I estimate a rough fair value for a stock myself?
You do not need a complicated model. Use purely illustrative figures: suppose a company earns ₹40 crore in net profit, has grown profit at roughly 12% a year for a decade, has ROCE around 18%, and carries almost no debt. If you decide that a business like that deserves 20 times earnings, your rough fair market value is ₹800 crore. If the market cap on the exchange is ₹1,400 crore, the market is paying 35 times — pricing in growth much faster than 12%. Your job is to decide whether that faster growth is credible.
Then flip it around, which is the more honest exercise. Take today's market cap and work out what profit growth would be needed over the next five years to justify it at a normal exit multiple. In the illustrative case above, ₹1,400 crore roughly demands profit doubling in five years. Now ask a concrete question: what capacity, what order book, what pricing power delivers that? If you cannot answer it in two sentences, you are hoping, not valuing.
Write your fair value estimate down as a range, never a single figure — say ₹190 to ₹230 rather than ₹211. Precision is false comfort. And always give yourself a margin: a price well below your estimated range is what protects you when your assumptions turn out to be optimistic, which they often will.
What is the difference between a cheap stock and a value trap?
A value trap is a stock that is cheap and stays cheap, or gets cheaper, because the business is quietly dying. The ratios look wonderful right up to the moment the earnings disappear. The way to tell them apart is to look at direction, not level. Falling revenue, thinning margins, rising debt, worsening working capital, an auditor's qualification, resignations of auditors or independent directors, rising promoter pledging, or falling promoter shareholding — these are all signs the low PE is deserved.
The opposite pattern — genuine undervaluation — usually has a boring, identifiable reason. A temporary problem the market is extrapolating forever. A bad quarter in a cyclical industry. A regulatory scare that is already priced in. A small company nobody covers. In these cases the balance sheet stays clean, cash keeps coming in, and the promoter is not selling.
Also check who owns the stock and why. Rising retail shareholding with falling institutional ownership is worth pausing over. Read the related-party transactions section of the annual report and the contingent liabilities note. Cheap valuation is never the reason to own something on its own. It only matters when the underlying business is intact.
What makes Indian retail investors overpay for a stock?
The commonest reason is buying a story after the price has already moved. A theme catches on — defence, railways, renewables, whatever is fashionable that year — and the price runs far ahead of any realistic earnings. By the time it reaches your feed, the easy money has been made, and you are paying for the next five years of growth today. That is the precise definition of overvalued.
The second reason is anchoring to a number that has nothing to do with value: the 52-week high, the price you first saw it at, or a friend's entry price. A stock that has fallen 40% is not cheap; it is 40% cheaper than it was. It might still be twice what the business is worth.
The third is ignoring costs and taxes when you churn. Frequent trading in and out means brokerage, STT, stamp duty, exchange charges and GST, plus short-term gains taxed more harshly than long-term gains. Overpaying and then trading frantically to fix it compounds the damage. If you got the price wrong, the fix is a better process next time, not more transactions.
Click Here – See BossInvestor's Data-Driven Stock Screens
Conclusion
Valuation is not one number — it is a comparison, done three ways: against the company's own history, against its peers, and against what the business actually earns and owns. Do those three checks honestly and you will rarely overpay badly, which matters more than catching every winner. As of August 2026, only 15.9% of Indian companies with full-year fundamentals cleared both a basic quality bar and a valuation check at the same time, so patience is a real edge. If you would rather see where that screen lands each month, our research team publishes its verified work inside the BossInvestor app after KYC.
BossInvestor is a SEBI Registered Research Analyst (INH000024143). This article is for educational and informational purposes only. It explains a method and is not investment advice, nor a recommendation to buy, sell or hold any security. Market-wide figures are computed from our universe as of August 2026; past metrics do not guarantee future results. Always do your own research or consult a registered adviser before investing.
Frequently Asked Questions
Is a low PE ratio always a sign of an undervalued stock?
No. A low PE often means the market expects earnings to fall. Cyclical companies show their lowest PE at the peak of the cycle, when profits are unsustainably high. A low PE is only interesting when revenue is stable or growing, margins are holding, debt is not rising and cash flow supports reported profit. Always check the direction the business is heading before treating a low PE as a bargain.
What is a normal PE ratio for an Indian stock?
There is no single normal, but there is a useful reference point. Across our universe of Indian companies with full-year fundamentals, the median PE was 24.0 as of August 2026, and 65.1% traded between 0 and 40. So the middle of the market sits in the low twenties. What matters more is the comparison: the stock's own ten-year average PE, and the PE of three or four direct competitors in the same industry.
Can I judge valuation using price-to-book alone?
Only for certain businesses. Price-to-book works well for banks, NBFCs and asset-heavy companies where the balance sheet reflects real earning assets. It works poorly for software, consumer brands and services firms, whose value sits in people, brands and contracts that barely appear on the balance sheet. For those, earnings, cash flow and return on capital tell you far more. Match the ratio to the industry rather than using one measure everywhere.
How often should I recheck whether a stock I own is still fairly valued?
Once every quarter, when results are filed with the exchanges, and again after the annual report. Check whether revenue, margins, cash flow and debt moved the way you expected, and whether the price has run far ahead of those numbers. You are not looking for reasons to trade. You are checking whether the reason you bought is still true. If the business thesis breaks, that is the signal, not the price move.
Does a stock falling 50% mean it has become undervalued?
Not by itself. A 50% fall only tells you the price is lower than it was, not that it is below the value of the business. If earnings have fallen 60%, the stock may actually be more expensive than before the fall. Recalculate the ratios on the latest reported numbers rather than the old ones. Price declines are a prompt to do the work again, never a conclusion on their own.
Related Blogs
How to Analyse a Stock Before Buying: A 10-Point Checklist
Published: Mon Sep 07 2026Read more…

How to Calculate Your Financial Freedom Number and Achieve It
Published: Tue May 20 2025Read more…
 (1).jpg)
From Signal to Strategy: The Moving Averages
Published: Tue May 20 2025Read more…

Market Share: The Silent Signal of Competitive Power and Investment Opportunity
Published: Wed May 14 2025Read more…