Large cap vs mid cap vs small cap: which is better?
A plain-language guide to how SEBI defines large, mid and small caps in India, what each one really costs you in volatility and liquidity, and a repeatable method to decide how much of each belongs in your portfolio. No tips, no targets — just the process.

BOSSINVESTOR
Mon Sep 07 2026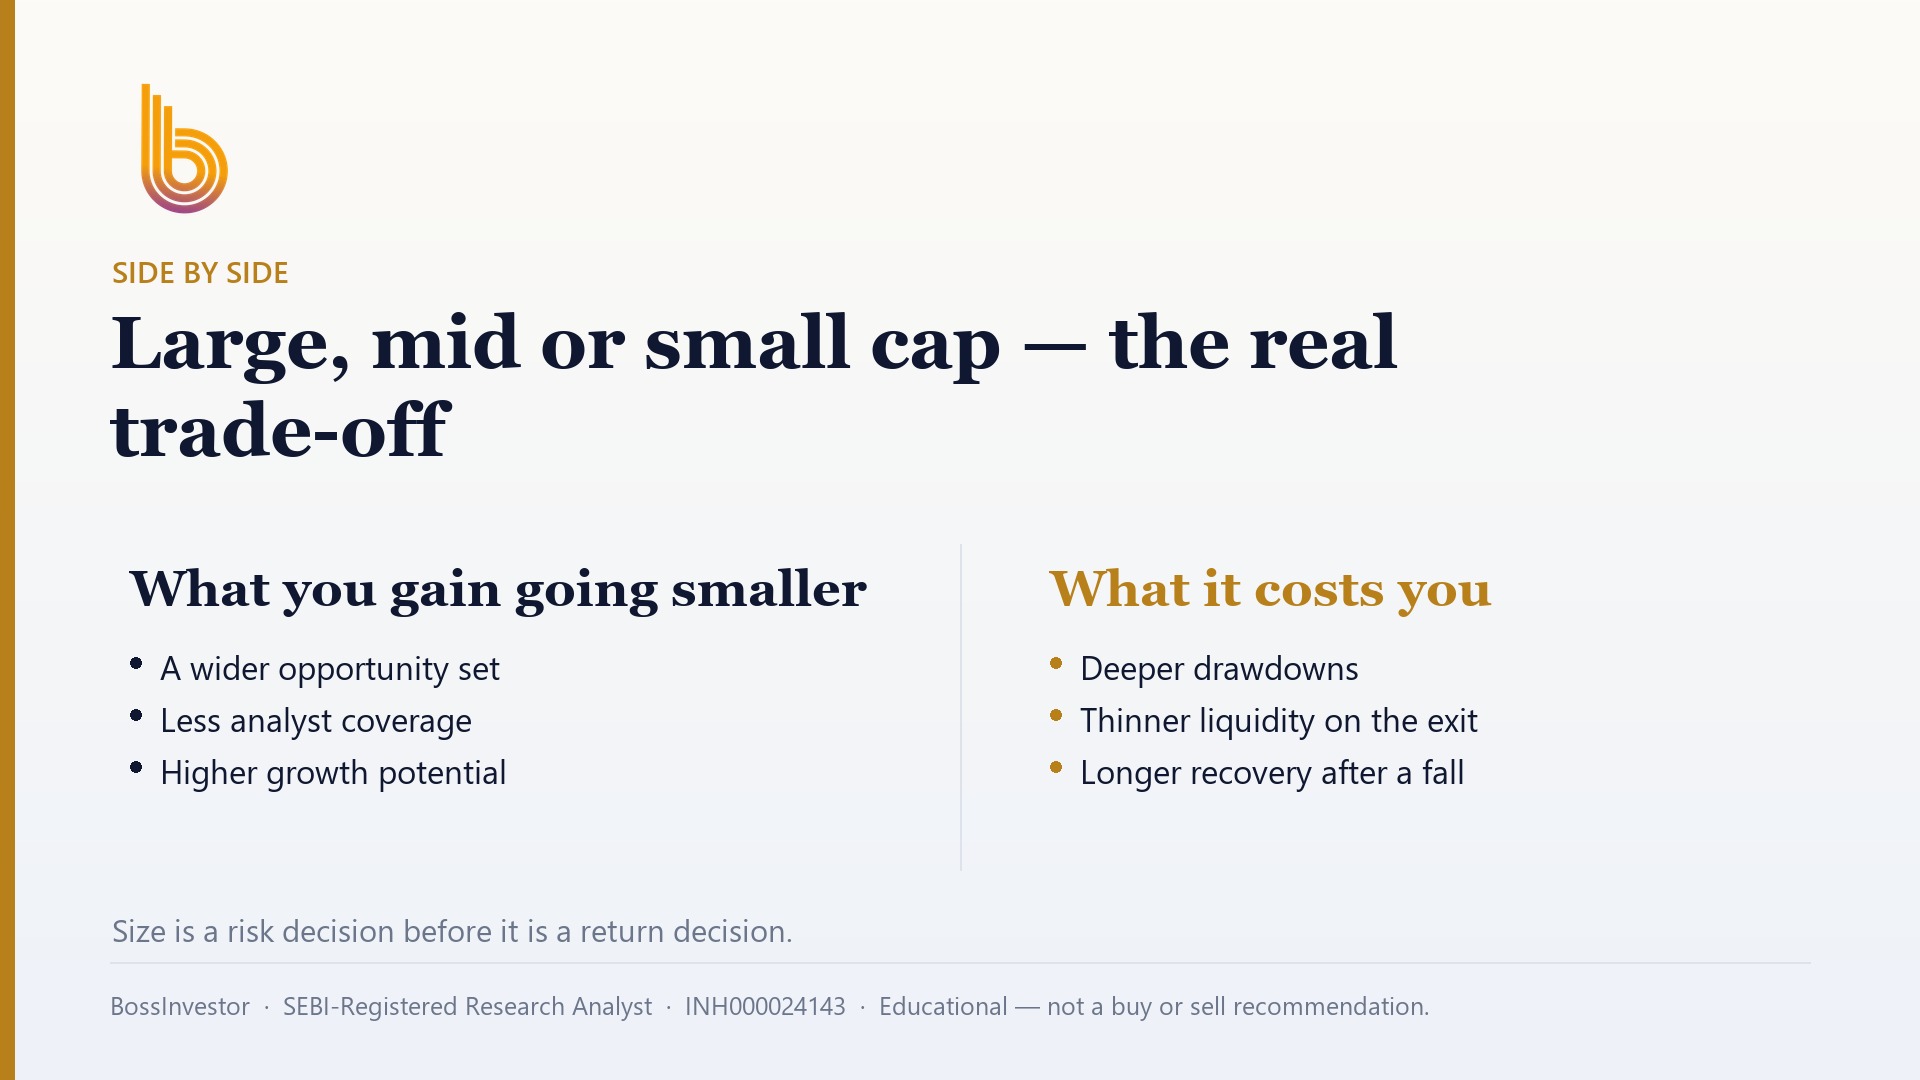
Which market cap segment should an Indian investor actually own?
None is better in the abstract — they answer different questions. Large caps give you stability and liquidity, mid caps give growth with real drawdowns, small caps give the highest upside and the highest chance of permanent loss. Most Indian retail portfolios should be built large-cap-first, then add mid and small caps only where the business quality survives a screen.
Key Takeaways
- SEBI/AMFI defines it by rank: top 100 companies are large cap, 101–250 mid cap, 251 onwards small cap — revised every six months.
- Higher return potential in small caps is paid for in drawdowns you must sit through without selling.
- Of 1,518 Indian listed companies with full-year fundamentals, only 22.0% clear ROE above 15%, ROCE above 15% and debt-to-equity below 1 together (BossInvestor universe, August 2026).
- Add a valuation filter (PE under 40) and just 15.9% survive — scarcity is worse further down the size ladder.
- Liquidity, not returns, is what usually hurts retail investors in small caps.
- Allocation should follow your holding period and your ability to not panic, not last year's chart.
What actually makes a company large cap, mid cap or small cap in India?
In India this is not a matter of opinion. SEBI standardised it in 2017 and AMFI publishes the list twice a year, in January and July. Every listed company on the NSE and BSE is ranked by full average market capitalisation. Ranks 1 to 100 are large cap. Ranks 101 to 250 are mid cap. Rank 251 and everything below is small cap. That is the entire definition.
Two things follow from this that most people miss. First, the labels are relative, not absolute. A company is not small because it is tiny in rupee terms — it is small because 250 companies are bigger. In a bull market, the cut-off for small cap keeps rising, so a business worth ₹30,000 crore can still sit in the small-cap bucket. Second, the labels move. A company you bought as a small cap can be re-classified as a mid cap after a rally, and mutual funds are then forced to rebalance around it. That forced buying and selling is a real source of price movement that has nothing to do with the business.
So when someone says "small caps are risky", ask which small cap. The bottom of the list includes companies with almost no institutional coverage, thin trading volumes and promoters who own most of the equity. That is a very different animal from a company sitting at rank 260.
Which segment gives higher returns over the long run?
The honest answer is that smaller companies have more room to grow, and therefore a wider range of outcomes in both directions. A company earning ₹50 crore a year can plausibly earn ₹500 crore in a decade. A company already earning ₹50,000 crore cannot grow ten-fold as easily — it runs into the size of the Indian economy itself.
But "higher potential return" is not the same as "higher return you actually received". The average small-cap investor underperforms the small-cap index, and the reason is behavioural, not analytical. Small caps fall harder and stay down longer. When the fall comes, most people sell near the bottom and buy back after the recovery is visible. The return existed on paper; it never reached the bank account.
There is also survivorship in how these stories get told. When you look at a list of the best-performing stocks of the last ten years, you are looking at the winners that survived. The companies from the same starting cohort that halved, got delisted, or ran into governance trouble are not on that list. Large caps have fewer of those disappearances. That is not a small advantage — it is most of the advantage.
How do I check business quality before buying a mid cap or small cap?
Use a fixed checklist, applied the same way every time, before you look at the price chart. A workable starting bar has three parts. Return on equity above 15% — is the company generating a decent return on the shareholders' money? Return on capital employed above 15% — is the underlying business itself productive, before financing tricks? Debt-to-equity below 1 — can it survive a bad year without the lenders deciding its future?
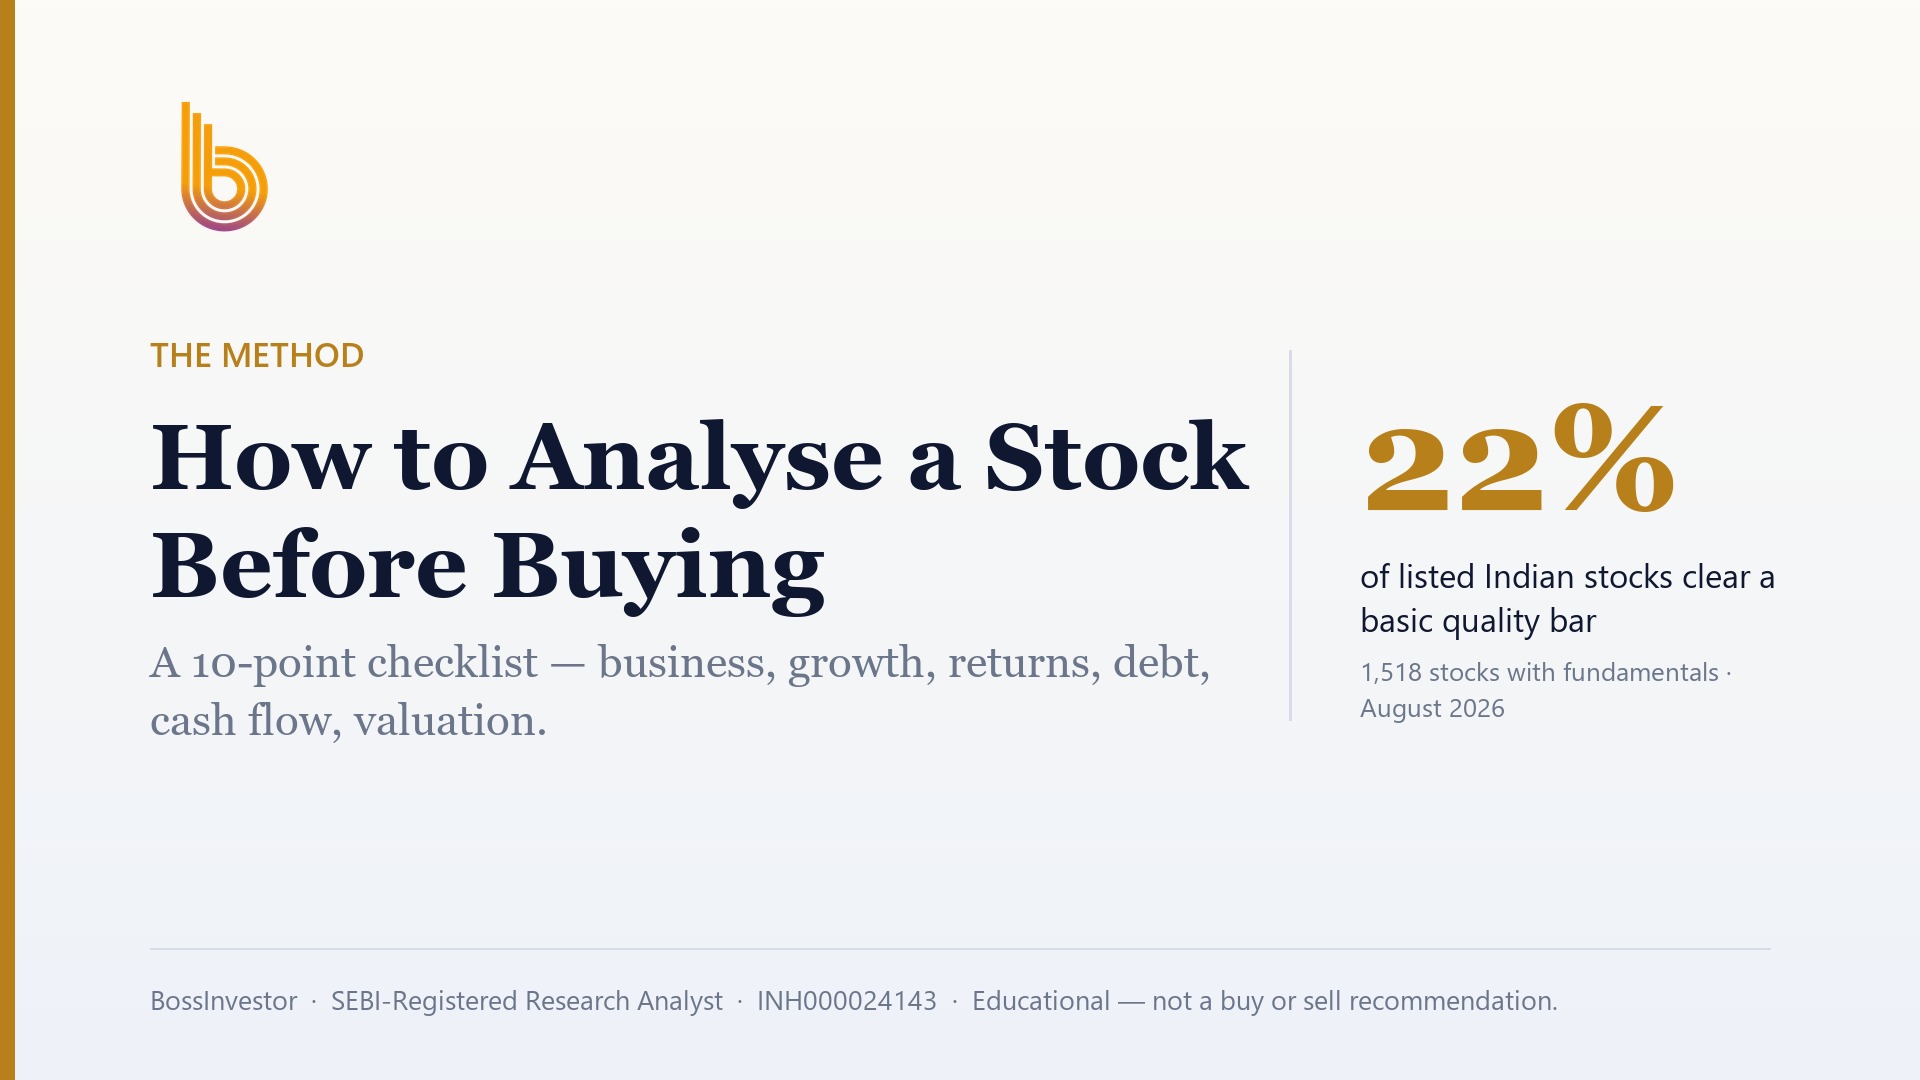
Here is why this matters more than any opinion about size. In our own universe of 1,852 listed Indian companies as of August 2026, 1,518 had full-year fundamentals we could test. Only 458 (30.2%) had ROE above 15%. Only 464 (30.6%) had ROCE above 15%. Debt was the easier hurdle — 1,282 companies (84.5%) had debt-to-equity below 1. But when all three had to be true at the same time, only 334 companies survived. That is 22.0% of the tested universe.
One caveat you should apply yourself: a flat debt-to-equity rule is unfair to banks and NBFCs, because borrowing money is literally their business model. For lenders, look at capital adequacy, asset quality and provisioning instead — do not disqualify them on a leverage ratio designed for manufacturers.
Does a good business automatically mean a good price?
No, and this is where most mid- and small-cap losses actually originate. People do the quality work, find a genuinely good company, and then pay a price that already assumes ten flawless years.
Add a simple valuation check to the quality screen — a PE between 0 and 40 — and the pool shrinks again. Of the 1,518 companies with fundamentals in our universe as of August 2026, 988 (65.1%) traded at a PE under 40. But combining that with the three quality tests left only 241 companies, or 15.9%. Roughly one company in six is both decently run and not obviously expensive. The median PE across the universe was 24.0.
PE is a blunt instrument and you should treat it as a first filter, not a verdict. It is meaningless for a loss-making company, misleading for a cyclical business at the top of its cycle, and it ignores growth entirely. But it does one useful job: it stops you from buying a fine company at a price where even a good decade delivers a poor return. If a stock clears your quality bar but sits far above the median, you are not banned from owning it — you just owe yourself an explanation of what growth you are underwriting.
Why does liquidity matter more than returns in small caps?
Because a return you cannot exit is not a return. In a large cap, you can sell ₹5 lakh of stock in seconds and the price will not notice. In a thinly traded small cap, the same order can move the price against you by several percent before it fills — that gap is called impact cost, and it is a real charge on your money that never shows up in any return calculation.
It gets worse in a falling market. Small caps often have 5% or 10% circuit filters on the NSE and BSE. When bad news hits, the stock can open at the lower circuit with no buyers at all. You are not choosing to hold — you simply cannot sell. Several consecutive lower circuits can take a position down a long way before you ever get a chance to act.
Before you buy anything outside the top 250, check the average daily traded value and the delivery volumes for the last few months. A practical rule: your intended position should be a small fraction of a normal day's trading, so that you can exit over a few days without becoming the market. If you cannot get out in a week under stress, size the position as if it might go to zero.
How should I split my money across the three segments?
Start from your holding period, not from last year's returns. Money you might need within three years has no business in mid or small caps at all. Money with a genuine seven-to-ten-year horizon can carry more.
A common starting frame for an investor with a long horizon and no special expertise: build the core in large caps, add a meaningful but secondary allocation to mid caps, and keep small caps as the smallest sleeve. Here is an illustrative example, using made-up round numbers purely to show the arithmetic. Suppose you have ₹10 lakh and split it ₹6 lakh large, ₹2.5 lakh mid, ₹1.5 lakh small. If small caps halve in a bad year while large caps fall 15% and mid caps fall 30%, your portfolio is down roughly ₹2.4 lakh, or about 24%. Those figures are hypothetical and not a forecast — the point is to see the number before it happens, and ask honestly whether you would still be holding.
That question is the whole allocation decision. If a 24% paper loss would make you sell everything, your small-cap sleeve is too big, regardless of what any model says. Rebalance once a year back to your chosen weights. This mechanically trims whatever has run and adds to whatever has lagged, which is exactly what almost nobody does voluntarily.
How does Indian tax treatment affect the choice?
For listed equity on the NSE and BSE where STT has been paid, gains on holdings of twelve months or less are short-term and taxed at 20%. Gains on holdings beyond twelve months are long-term, taxed at 12.5%, with the first ₹1.25 lakh of long-term gains in a financial year exempt. Dividends are added to your income and taxed at your slab rate.
The practical consequence is that churn is expensive, and churn is exactly what small caps tempt you into. Every time you exit a position inside a year, you hand over a fifth of the gain, plus brokerage, STT, exchange charges and stamp duty. A strategy that needs frequent trading to work has to clear a much higher bar than a strategy that does not.
Long-term capital losses can be set off against long-term gains and carried forward for eight assessment years if you file your return on time — worth knowing, but never a reason to hold a broken business. Selling a bad position to book a loss is a tax decision that follows the investment decision; it should not lead it.
What are the most common mistakes Indian retail investors make here?
The first is chasing the segment that just did well. Small-cap inflows peak after small caps have already run, which means the money arrives at the worst prices. If a segment is in every headline and every reel, you are early to nothing.
The second is confusing a low share price with a cheap stock. A ₹12 share is not cheaper than a ₹4,000 share. What matters is the price relative to the earnings and assets behind it, and the number of shares outstanding.
The third is over-diversifying into names you cannot follow. Twenty-five small caps is not a portfolio, it is a list. If you cannot say in two sentences what each company sells and why it earns a decent return on capital, you are not investing, you are collecting.
The fourth is treating quality as a one-time check. ROE and ROCE drift. Debt creeps up. Promoters pledge shares. Re-run the same screen every quarter on what you own, and act when a holding stops clearing the bar you set at purchase — not when the price tells you something is wrong, because by then the price has already told everyone.
Click Here – See BossInvestor's Data-Driven Stock Screens
Conclusion
The size label is a starting filter, not an answer. Rank the company by SEBI's definition, run the same quality checklist every time, apply a valuation sanity check, confirm you can actually exit the position, and only then decide how much to own. The numbers from our August 2026 universe explain why this order matters: 22.0% of tested companies clear a basic quality bar, and 15.9% clear it at a sensible price. If you want to see which specific names currently pass those screens in our coverage, that sits behind KYC in the BossInvestor app.
BossInvestor is a SEBI Registered Research Analyst (INH000024143). This article is for educational and informational purposes only. It explains a method and is not investment advice, nor a recommendation to buy, sell or hold any security. Market-wide figures are computed from our universe as of August 2026; past metrics do not guarantee future results. Always do your own research or consult a registered adviser before investing.
Frequently Asked Questions
Are small caps always riskier than large caps?
Usually, but not automatically. Risk comes from the business and the price you pay, not from the AMFI rank. A debt-free small cap earning a high return on capital and trading at a reasonable multiple can be safer than a heavily indebted large cap at a stretched valuation. That said, small caps carry two structural risks large caps do not: thin liquidity that can trap you during a fall, and far less analyst and regulatory scrutiny of what management says.
Should a beginner start with large caps?
For most beginners, yes. Large caps give you time to learn without the portfolio swinging so hard that you abandon the plan. They are well covered, easy to research, and easy to exit. Build the habit of investing regularly, sit through one real correction, and see how you actually behave. Once you have survived a bad year without selling, adding a mid-cap sleeve is a reasonable next step. Small caps should come last, if at all.
How often does a stock change from small cap to mid cap in India?
AMFI publishes the classification twice a year, based on average full market capitalisation over the previous six months. So reclassification can happen every January and July. A strong rally can push a company from small cap into mid cap, and a poor stretch can push it back down. This matters because mutual funds have mandates tied to those buckets, so reclassification triggers forced buying or selling that moves prices for reasons unconnected to the business.
Is it better to buy mid and small caps through mutual funds or directly?
Funds solve two problems you may not be able to solve yourself: liquidity and research depth. A fund manager can hold thirty small caps and absorb impact costs across a large pool. Direct investing gives you control, no expense ratio, and no forced buying when the fund gets inflows. The deciding question is time. If you cannot re-check the fundamentals of every holding each quarter, use funds for the smaller-cap portion.
What percentage of Indian listed companies are actually investment grade?
By a basic quality bar, fewer than most people expect. In BossInvestor's universe as of August 2026, 1,518 of 1,852 listed companies had full-year fundamentals we could test. Only 334 of those, or 22.0%, had ROE above 15%, ROCE above 15% and debt-to-equity below 1 at the same time. Adding a PE-under-40 check left 241 companies, or 15.9%. Note that banks and NBFCs are unfairly excluded by a flat debt rule and need separate criteria.
Related Blogs
How to Analyse a Stock Before Buying: A 10-Point Checklist
Published: Mon Sep 07 2026Read more…

How to Calculate Your Financial Freedom Number and Achieve It
Published: Tue May 20 2025Read more…
 (1).jpg)
From Signal to Strategy: The Moving Averages
Published: Tue May 20 2025Read more…

Market Share: The Silent Signal of Competitive Power and Investment Opportunity
Published: Wed May 14 2025Read more…