How Much Do Trading Costs Eat Your Returns in India?
Brokerage is the small number everyone quotes. The costs that actually decide your after-tax return are STT, GST, stamp duty and exchange fees — and how often you trade. Here is the maths, with the exact 2026 rates, and a simple formula to measure the drag on your own portfolio.

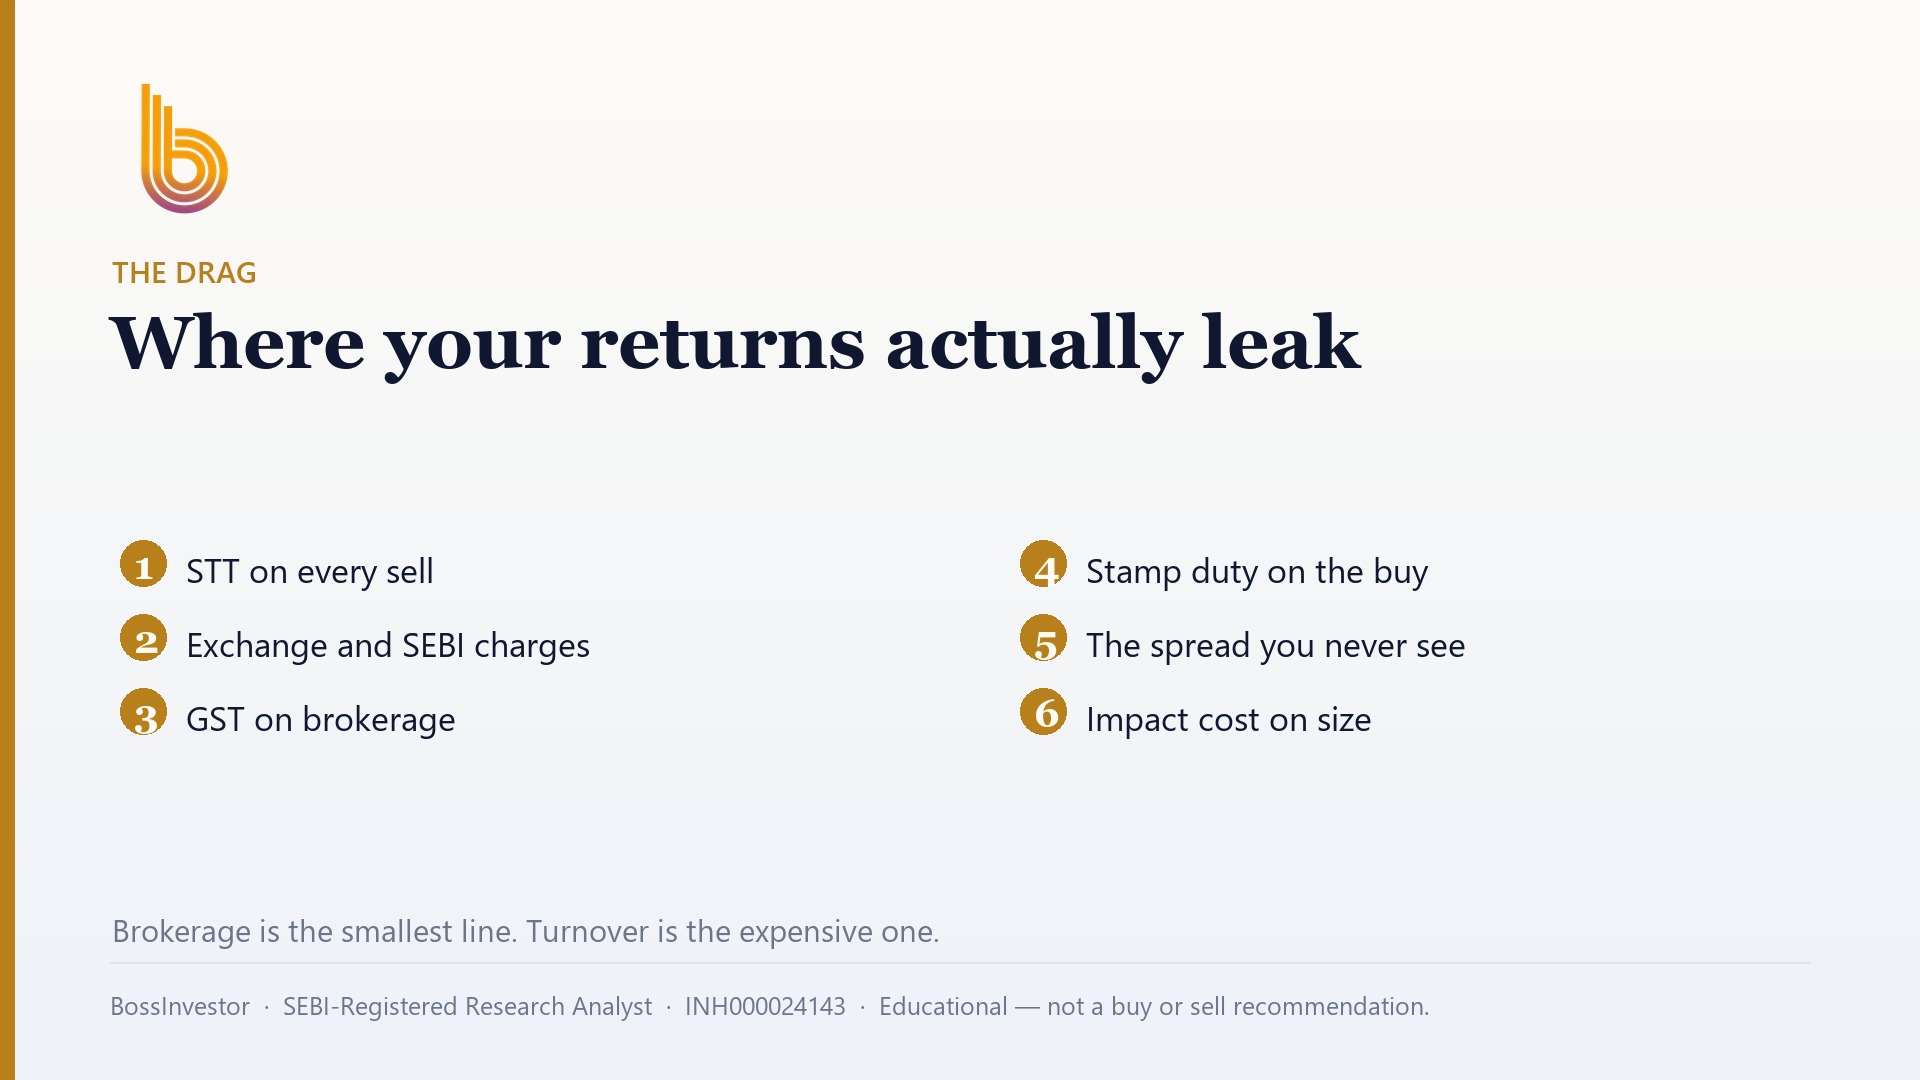
How Much Do Trading Costs Actually Cost in India?
For equity delivery through a discount broker, a full round trip (one buy and one sell) costs roughly 0.20% to 0.25% of the amount traded once brokerage, Securities Transaction Tax (STT), stamp duty, exchange fees, SEBI turnover fees and GST are added up. STT is the single largest component. The headline "zero brokerage" number is real but misleading — the statutory charges are what you actually pay. Crucially, this cost is charged every time you trade, so your real annual drag is set by your turnover, not by the cost of any one trade. A buy-and-hold investor pays it once every few years; a high-churn portfolio can lose 1% to 3% of its return to costs every single year.
Key Takeaways
- On equity delivery, the cost stack (as of 2026) is: brokerage ₹0 at most discount brokers, STT 0.1% on both buy and sell, stamp duty 0.015% on buy only, exchange transaction charges ~0.003% per side, SEBI turnover fee 0.0001% per side, and 18% GST on brokerage plus exchange charges — roughly 0.20-0.25% per round trip.
- Brokerage is usually the smallest line item on a delivery trade. STT dominates.
- The number that matters is annual portfolio turnover. Cost drag is approximately turnover multiplied by round-trip cost.
- A portfolio turning over 300% per year at a 0.22% round-trip cost bleeds roughly 0.66% a year — before slippage and impact cost.
- Because returns compound, a 1% annual cost drag can erase a meaningful share of terminal wealth over 10+ years.
- The only honest way to know a strategy's real return is to backtest it with these costs subtracted on every rebalance.
Introduction: The Cost You Don't See on the Contract Note Headline
Ask most Indian investors what it costs to trade and they will say "nothing — my broker charges zero brokerage on delivery." That is true, and it is also the least important part of the answer. The Indian equity cost structure is built almost entirely out of statutory charges levied by the government, the exchanges and the regulator. These do not disappear when brokerage goes to zero. They sit quietly on your contract note, and they scale with one behaviour you control: how often you buy and sell.
This article breaks the cost stack into its exact components at 2026 rates, then gives you a one-line formula to estimate the drag on your own portfolio. It is written as a measurement exercise, not a recommendation — the goal is to help you see a number that is usually hidden.
What Are the Exact Charges on an Indian Equity Trade in 2026?
Here is the full stack for a delivery-based equity trade at a typical discount broker. Rates are statutory and apply regardless of which broker you use; only the brokerage line and the flat depository (DP) charge vary.
| Charge | Rate (equity delivery, 2026) | Applies to |
|---|---|---|
| Brokerage | ₹0 at most discount brokers (delivery) | Both legs |
| Securities Transaction Tax (STT) | 0.1% | Buy and sell (both legs) |
| Stamp duty | 0.015% | Buy side only |
| Exchange transaction charge (NSE) | ~0.003% | Both legs |
| SEBI turnover fee | 0.0001% (₹10 per crore) | Both legs |
| GST | 18% | On brokerage + exchange transaction charge |
| Depository (DP) charge | ~₹13-20 flat per scrip | Sell side only |
Two features of this table decide everything. First, STT is charged on both the buy and the sell leg on delivery (0.1% each), so it contributes about 0.2% to a round trip on its own — larger than every other line combined for most trade sizes. Second, the DP charge is flat, which means it hurts small trades far more in percentage terms than large ones. A ₹5,000 sell with a ₹15 DP charge loses 0.30% to that one line; a ₹5,00,000 sell loses 0.003%.
Why Is Turnover the Number That Matters, Not the Cost Per Trade?
A round-trip cost of ~0.22% sounds trivial, and for a long-term investor it is. The reason costs quietly destroy returns for active investors is frequency. Every time you replace a holding, you pay the round trip again. Annual portfolio turnover measures exactly this: a turnover of 100% means you replaced your entire portfolio once during the year; 500% means you churned it five times over.
The drag is close to linear:
Annual cost drag ≈ Annual turnover × Round-trip cost per rupee traded
The table below applies that formula at a round-trip delivery cost of 0.22% (excluding the flat DP charge and any slippage). These are illustrative scenarios to show the shape of the relationship, not figures from any specific account.
| Investor style | Approx. annual turnover | Estimated annual cost drag |
|---|---|---|
| Buy and hold (rebalance rarely) | ~20% | ~0.04% |
| Long-term, periodic rebalancing | ~100% | ~0.22% |
| Active swing / momentum | ~300% | ~0.66% |
| High-churn trading | ~600%+ | ~1.3%+ |
Add realistic slippage and impact cost — the gap between the price you see and the price you actually get, which widens in less liquid stocks — and the true drag for active styles is often meaningfully higher than the statutory figure alone.
How Big Is the Drag Over 10 Years?
Costs compound against you the same way returns compound for you. Consider two portfolios that both earn a 12% gross annual return before costs. One is a low-turnover portfolio losing 0.2% a year to costs; the other is a high-churn portfolio losing 1.5% a year. Over a decade, the low-cost portfolio compounds at ~11.8% and the high-cost one at ~10.5%. On a ₹10,00,000 starting corpus, that difference in net compounding rate produces a gap of several lakh rupees in terminal wealth — purely from friction, with identical stock-picking skill. The lesson is not "never trade." It is that every extra rotation must earn back its cost before it adds anything.
How Do You Measure and Reduce Your Own Cost Drag?
You can estimate your drag in three steps, and this is exactly the discipline a research process should enforce:
- Estimate your turnover. Total value of all buys (or sells) in a year, divided by your average portfolio value. Most broker statements let you total this.
- Multiply by round-trip cost. Use ~0.22% for delivery as a floor, then add a slippage buffer for less liquid names.
- Compare drag to the edge. If a more active strategy costs you 1% a year in friction, it has to beat a simpler, lower-turnover approach by more than 1% a year just to break even.
This is where a measurement-first process matters more than a hot tip. At BossInvestor, strategies are backtested with realistic transaction costs subtracted at every rebalance, so the return you evaluate is an after-cost return, not a gross one that quietly ignores the friction. A strategy that looks great before costs and mediocre after costs is one the numbers should reject.
Click Here – See How BossInvestor Backtests Strategies After Costs
Conclusion
Trading costs in India are not the brokerage number on the ad. They are a stack of statutory charges — STT above all — that you pay every time you trade, and their total bite on your returns is decided by how often you rotate your portfolio. For a genuine long-term investor the drag is a rounding error; for an active trader it can quietly consume a large share of the edge they are working so hard to capture. The practical takeaway is to measure it: know your turnover, multiply by the round-trip cost, and demand that any extra activity earns back its friction before you call it a strategy.
BossInvestor is a SEBI Registered Research Analyst (INH000024143). This article is for educational and informational purposes only. It explains how to measure costs and is not investment advice, nor a recommendation to buy, sell or hold any security. Statutory rates are as of 2026 and can change; verify current rates with your broker and the exchanges before acting. Backtested figures are based on historical data and do not guarantee future performance.
Frequently Asked Questions
How much does it cost to buy and sell shares in India?
For equity delivery through a discount broker, brokerage is typically zero, but statutory costs still apply: STT at 0.1% on both the buy and the sell leg, stamp duty at 0.015% on the buy side, exchange transaction charges of roughly 0.003% per side, a SEBI turnover fee of 0.0001% per side, and 18% GST on brokerage plus exchange charges. Together these come to roughly 0.20-0.25% of turnover for a full round trip, with STT the largest single component. A flat DP charge of about ₹13-20 is also debited per scrip on the sell side.
Is STT charged on both buy and sell in India?
For equity delivery trades, STT is charged at 0.1% on both the buy and the sell transaction. For intraday equity trades, STT is charged only on the sell side, at 0.025%. Stamp duty, by contrast, is charged only on the buy side.
Do trading costs really affect long-term returns?
Yes, but the impact depends almost entirely on turnover, not on the cost per trade. A buy-and-hold investor who trades once every few years pays the round-trip cost only once, so the drag is negligible. A portfolio that turns over five times a year pays that cost ten times as often, which can translate into a 1-3% annual return drag. Because returns compound, even a 1% annual cost drag can consume a large share of terminal wealth over a decade.
How do I calculate the annual cost drag on my portfolio?
Use the formula: annual cost drag is approximately your annual portfolio turnover multiplied by the round-trip cost per rupee traded. For example, at a round-trip delivery cost of about 0.22% and a turnover of 300% a year, the estimated drag is roughly 0.66%. Backtesting a strategy with realistic costs subtracted on every rebalance is the only reliable way to see the true, after-cost return.
Related Blogs
How to Analyse a Stock Before Buying: A 10-Point Checklist
Published: Mon Sep 07 2026Read more…

How to Calculate Your Financial Freedom Number and Achieve It
Published: Tue May 20 2025Read more…
 (1).jpg)
From Signal to Strategy: The Moving Averages
Published: Tue May 20 2025Read more…

Market Share: The Silent Signal of Competitive Power and Investment Opportunity
Published: Wed May 14 2025Read more…