What is a good debt to equity ratio for a stock?
Most investors are told "low debt is good" and then left to guess what low means. This page gives you the actual bands, how to calculate the ratio from an Indian balance sheet, the sectors where the rule changes, and the one industry where the ratio should be ignored completely.

BOSSINVESTOR
Mon Sep 07 2026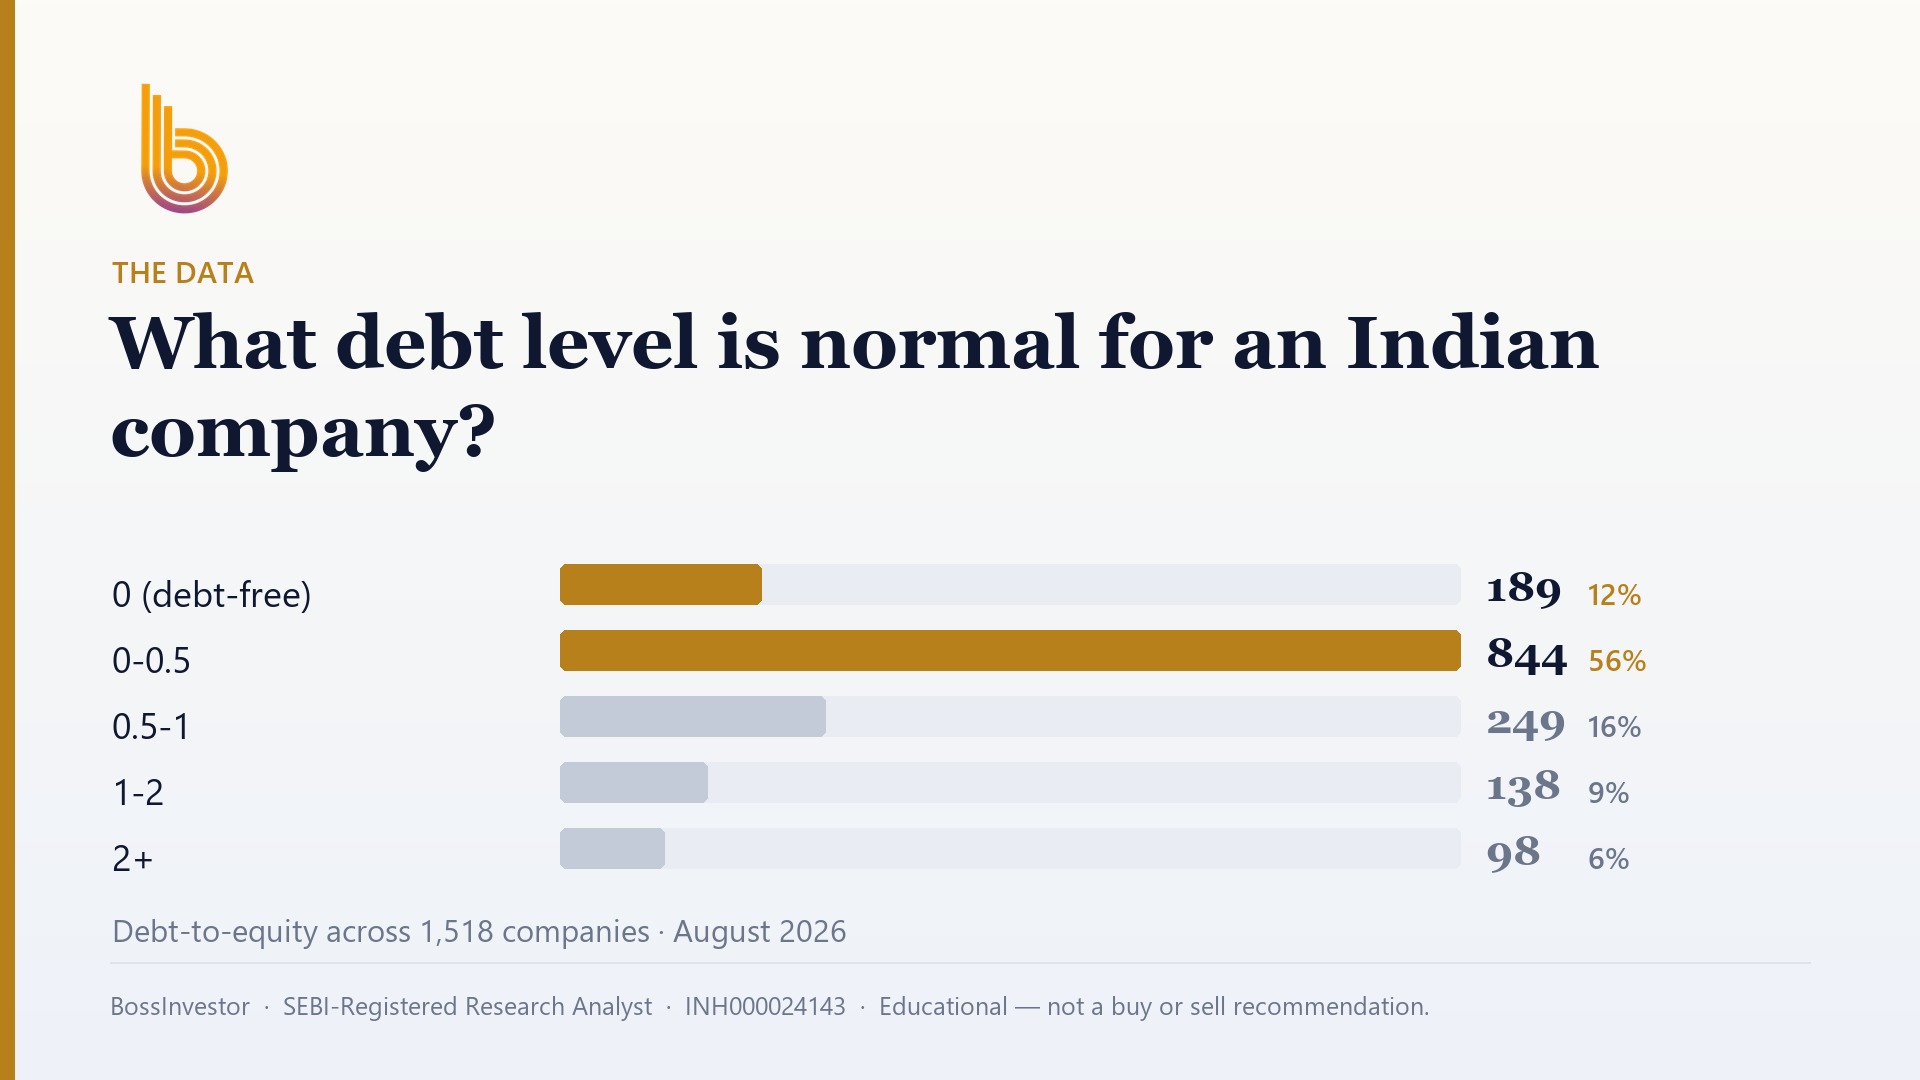
What counts as a healthy debt to equity ratio for an Indian stock?
For most Indian companies, a debt-to-equity ratio below 1 is comfortable, below 0.5 is strong, and above 2 needs a very good reason. But the number is meaningless for banks and NBFCs, where borrowing is the business model. Always read it alongside interest cover, cash flow, and the five-year trend.
Key Takeaways
- Debt to equity = total borrowings ÷ shareholders' funds; below 1 is the common comfort line in India.
- Below 0.5 is conservative, 1 to 2 needs a reason, above 2 means almost no room for a bad year.
- The ratio is useless for banks and NBFCs — borrowing is their raw material, not their risk.
- Compare within the sector: a cement plant and a software firm cannot share the same cut-off.
- Of 1,518 Indian companies with full-year fundamentals, 84.5% already have debt to equity below 1 (as of August 2026) — so low debt alone filters almost nothing.
- Only 22.0% of that same set clear ROE above 15%, ROCE above 15% and debt to equity below 1 together.
What does the debt to equity ratio actually measure?
Debt to equity is one number: total borrowings divided by shareholders' funds. Take an illustrative example — a company listed on the NSE with ₹500 crore of borrowings and ₹1,000 crore of shareholders' funds has a debt to equity of 0.5. In plain words, for every rupee the owners have put into the business, the company has borrowed fifty paise from someone else.
That is the entire calculation. What makes it worth your time is what it implies about pressure. Equity is patient money. Shareholders cannot walk in next quarter and demand their capital back. Debt is impatient money. Interest has to be paid whether the company had a record year or a disastrous one, and the principal falls due on a date fixed years earlier. It is the difference between buying a flat with your own savings and buying it with an EMI that arrives on the fifth of every month, including the month you lose your job.
So debt to equity is not really a measure of how much a company owes. It is a measure of how little room it has to have a bad year. A company at 0.3 can absorb two weak quarters and nobody outside the finance department notices. A company at 3.0 can be forced into a rights issue, an asset sale, or a restructuring by the same two quarters.
How do I calculate debt to equity from an Indian annual report?
Open the standalone or consolidated balance sheet in the annual report, or the latest results filed with the NSE and BSE. On the liabilities side you want three lines: non-current borrowings, current borrowings, and current maturities of long-term debt. Add them up — that is your total debt. Then find equity share capital and other equity (older formats say reserves and surplus). Add those two — that is shareholders' funds, also called net worth. Divide the first by the second.
An illustrative worked example: non-current borrowings ₹420 crore, current borrowings ₹130 crore, current maturities ₹50 crore, so total debt is ₹600 crore. Equity share capital ₹100 crore plus other equity ₹900 crore gives net worth of ₹1,000 crore. Debt to equity is 600 ÷ 1,000 = 0.6. These figures are made up purely to show the arithmetic.
Two things trip people up. First, some screeners use net debt — total debt minus cash and investments — which can turn 0.6 into 0.2 for a cash-rich company. Second, after Ind AS 116, long-term lease liabilities sit on the balance sheet and some data providers include them as debt while others do not. This matters a lot for retail, hotels, and airlines. Pick one definition, know which one your screener uses, and stay consistent. A ratio you compare across two different definitions is worse than no ratio at all.
What debt to equity bands should I use when screening Indian stocks?
Use four bands as a starting frame. Below 0.5 is conservative — the business largely funds itself and a rate hike is an irritation, not a threat. Between 0.5 and 1.0 is normal and healthy for most manufacturers and mid-sized companies. Between 1.0 and 2.0 is not automatically bad, but you now owe yourself an explanation: what is the debt funding, and when does the asset it bought start generating cash? Above 2.0, the company has very little margin for error, and the equity you buy is a thin slice sitting behind a lot of lenders.
These bands are a starting point, not a verdict. Two adjustments make them far more useful. The first is comparison within the sector — a ratio of 1.4 may be conservative for a road developer and reckless for a software services firm. The second, and the one most retail investors skip, is direction. A company that has moved from 2.5 to 1.2 over five years is a deleveraging story where profits are increasingly flowing to owners instead of lenders. A company that has drifted from 0.4 to 1.1 over the same period is doing the opposite, even though its current ratio still looks acceptable on a screener.
Pull five years of the ratio before you form a view. One year is a photograph. Five years is the behaviour of the management team, and behaviour is what you are actually buying.
Is zero debt always better for a company?
No, and this is where the "debt is bad" instinct becomes expensive. Interest is a deductible expense for corporate tax in India, so borrowed money costs a company less after tax than the coupon suggests. A business that can earn 20% on capital while borrowing at 9% and refuses to borrow at all is leaving growth on the table. That shows up as a lower return on equity than the same business would produce with a sensible amount of debt.
There is also a less comfortable reading of a permanently debt-free balance sheet with slow growth: nobody inside the company can find a project worth funding. Cash piling up in fixed deposits year after year is not conservatism, it is capital allocation failure wearing conservatism's clothes.
That said, zero or near-zero debt has a real, unglamorous advantage. It makes the company's survival independent of the RBI rate cycle, of lender sentiment, and of whether the promoter can refinance in a bad market. In India, where mid and small caps can lose access to funding quickly when credit conditions tighten, that matters. Low debt does not make a stock a good investment. It makes a bad year survivable, which is a different and more modest promise — and worth having.
Which sectors are allowed to carry more debt than others?
Debt appetite follows asset intensity. Power generation, road and transmission assets, cement, steel, telecom, real estate, shipping, hotels, and heavy capital goods all need enormous upfront capital that pays back over a decade or more. It would be economically silly to fund that entirely with equity, and these sectors routinely operate above 1.0 without anyone panicking — particularly where the cash flow is contracted or regulated, as in a transmission asset with a long-term agreement.
At the other end sit the asset-light businesses: IT services, FMCG, pharma formulations, consumer brands, exchanges, asset managers, and most platform companies. They convert profits to cash quickly and need little fixed capital, so many of them run at or near zero debt. Applying a "below 1 is fine" rule here is far too generous. For an established IT services company, a debt to equity of 0.8 is not comfortable — it is a question that needs answering.
The practical fix is simple. Do not screen against a single national cut-off. Screen against the sector, then against the company's own history. If a company's debt to equity is well above the typical level for its industry and rising, the burden of proof sits with the company, not with your scepticism.
Why does debt to equity break down for banks and NBFCs?
Because for a lender, borrowing is not a risk taken on the side — it is the raw material. A bank takes deposits and borrows in the market, then lends that money out at a higher rate. An NBFC borrows from banks, mutual funds, and bond investors and does the same. Their entire business model is to hold a very large balance sheet on a relatively small equity base. Ratios of six, eight, or ten times equity are ordinary in Indian financials and say nothing about danger.
This is the honest caveat on any debt-based screen, including ours: a flat debt-to-equity rule unfairly penalises banks and NBFCs and will quietly delete most of the financial sector from your list. If you are looking at a lender, throw the ratio out and use the measures that were designed for the job — capital adequacy against the RBI's requirement, gross and net NPAs, provision coverage, cost of funds versus lending yield, the share of low-cost CASA deposits for a bank, and how concentrated the borrowing sources are for an NBFC.
The last point deserves emphasis. Indian NBFC stress episodes have usually been funding-mix problems — short-term borrowings financing long-term loans — rather than an unusual debt-to-equity number. The ratio would not have warned you. The asset-liability maturity table would have.
What should I check alongside debt to equity?
Debt to equity tells you the size of the borrowing. It says nothing about whether the company can service it. Start with interest cover: operating profit divided by interest cost. If profit covers interest several times over, the company is comfortable. If it covers it barely once or twice, every small dip in demand goes straight into a default conversation. This single check separates a heavy but healthy borrower from a genuinely stressed one better than the debt ratio itself.
Then look at cash, not profit. Compare cash flow from operations across five years with interest paid plus scheduled repayments. Profits can be reported; cash has to actually arrive. Alongside that, check total debt against operating profit before depreciation — how many years of current earnings would it take to clear the borrowings? A business that would need a decade is in a very different position from one that would need two years.
Finally, read the notes most people skip. Contingent liabilities and guarantees given to group companies are debt that has not shown up on the balance sheet yet. Promoter share pledging, disclosed in the shareholding pattern filed with the exchanges, tells you whether a falling stock price can itself trigger forced selling. And check whether the borrowings are floating-rate or foreign-currency — a company with repo-linked loans and a stretched working capital cycle feels a rate hike immediately, while one with fixed long-tenure rupee debt does not.
How many Indian stocks actually pass a low-debt quality screen?
This is where the real surprise sits. Across our universe of 1,852 listed Indian companies, 1,518 have full-year fundamentals available. Of those, 1,282 companies — 84.5%, as of August 2026 — already have a debt to equity below 1. Read that again. Screening for low debt on its own removes barely one company in six. It feels like a filter. It is closer to a formality.
Debt only starts working as a filter when you combine it with returns. Of the same 1,518 companies, only 334 — 22.0%, as of August 2026 — clear a basic quality bar of return on equity above 15%, return on capital employed above 15%, and debt to equity below 1 all at the same time. Add a valuation check of a PE under 40 and just 241 companies survive, or 15.9%. For context, the median PE across this set is 24.0.
The lesson for your own process is direct. A low debt to equity is a hygiene check, not an edge — most of the market passes it. The scarcity is in companies that stay unleveraged while still earning high returns on the capital they employ, and that are not already priced for perfection. And remember the caveat above: because this screen uses a flat debt rule, banks and NBFCs are pushed out of it unfairly, so a financial company's absence from such a list means nothing about its quality.
Click Here – See BossInvestor's Data-Driven Stock Screens
Conclusion
Treat debt to equity as the first question, never the last one. Below 1 is comfortable, below 0.5 is strong, above 2 needs a real explanation — but then check interest cover, cash flow, the five-year direction, and the sector norm, and drop the ratio entirely for banks and NBFCs. That method is yours to run on any stock on the NSE or BSE for free. If you would rather see which companies currently clear the full quality-and-valuation bar in our research, that sits behind KYC in the BossInvestor app.
BossInvestor is a SEBI Registered Research Analyst (INH000024143). This article is for educational and informational purposes only. It explains a method and is not investment advice, nor a recommendation to buy, sell or hold any security. Market-wide figures are computed from our universe as of August 2026; past metrics do not guarantee future results. Always do your own research or consult a registered adviser before investing.
Frequently Asked Questions
Is a debt to equity ratio of 2 too high for an Indian company?
For most companies, yes — 2 means lenders have put in twice what owners have, so there is very little cushion for a weak year. The exception is capital-intensive businesses with contracted or regulated cash flows, such as transmission or road assets, where long-dated debt is matched to long-dated income. Before judging it, check interest cover and whether the ratio has been falling or rising over five years. Direction matters as much as level.
Should I use total debt or net debt to calculate the ratio?
Total debt is the stricter and safer default, because cash can be spent, pledged, or trapped in subsidiaries while the borrowings stay. Net debt — total debt minus cash and liquid investments — is a fair second view for genuinely cash-rich companies and is worth looking at alongside. The rule that matters is consistency: never compare a total-debt ratio for one company with a net-debt ratio for another. Check which basis your screener uses before you trust a comparison.
Does a zero debt stock mean it is safe to invest in?
No. Zero debt removes one specific risk — being forced into a crisis by lenders or a rate cycle. It says nothing about demand for the product, pricing power, management quality, accounting honesty, or the price you are paying. Plenty of debt-free companies earn poor returns on capital and go nowhere for years, and a debt-free stock bought at an extreme valuation still loses money. Low debt makes a bad year survivable; it does not make an investment good.
Why do banks show a debt to equity ratio of 8 or more?
Because borrowing is what a bank sells. It takes deposits and market borrowings, lends them at a higher rate, and earns the spread. Holding a large balance sheet on a smaller equity base is the business model, not a warning sign, and Indian banks and NBFCs routinely sit at multiples that would be alarming for a manufacturer. Judge them on capital adequacy against RBI norms, gross and net NPAs, provision coverage, cost of funds, and the stability of their funding mix instead.
How often should I recheck a company's debt to equity ratio?
Once every quarter, when results are filed with the NSE and BSE, is enough for most investors. Borrowings can rise sharply within a single quarter if a company funds an acquisition or a large capacity expansion, so an annual check can leave you a year behind. Also revisit it whenever the company announces a big capex plan, an acquisition, a rights issue, or a refinancing — those are the events that actually move the ratio, and they are announced before they show up in the numbers.
Can a company hide debt so the ratio looks better?
It can look better than reality without anything illegal happening. Debt parked in subsidiaries or associates may not appear in standalone accounts, so always read consolidated numbers. Guarantees given to group companies sit in contingent liabilities in the notes rather than on the balance sheet. Operating lease commitments, supplier financing arrangements, and heavy customer advances can all fund the business without being labelled borrowings. Read the notes to accounts and the auditor's report — that is where the fuller picture usually lives.
Related Blogs
How to Analyse a Stock Before Buying: A 10-Point Checklist
Published: Mon Sep 07 2026Read more…

How to Calculate Your Financial Freedom Number and Achieve It
Published: Tue May 20 2025Read more…
 (1).jpg)
From Signal to Strategy: The Moving Averages
Published: Tue May 20 2025Read more…

Market Share: The Silent Signal of Competitive Power and Investment Opportunity
Published: Wed May 14 2025Read more…