What is a good PE ratio for Indian stocks?
PE is the number every Indian investor quotes and almost nobody uses properly. This page explains what the ratio actually measures, what a normal PE looks like in the Indian market today, and how to tell a genuine bargain from a trap. No tips, just the method.

BOSSINVESTOR
Sun Sep 06 2026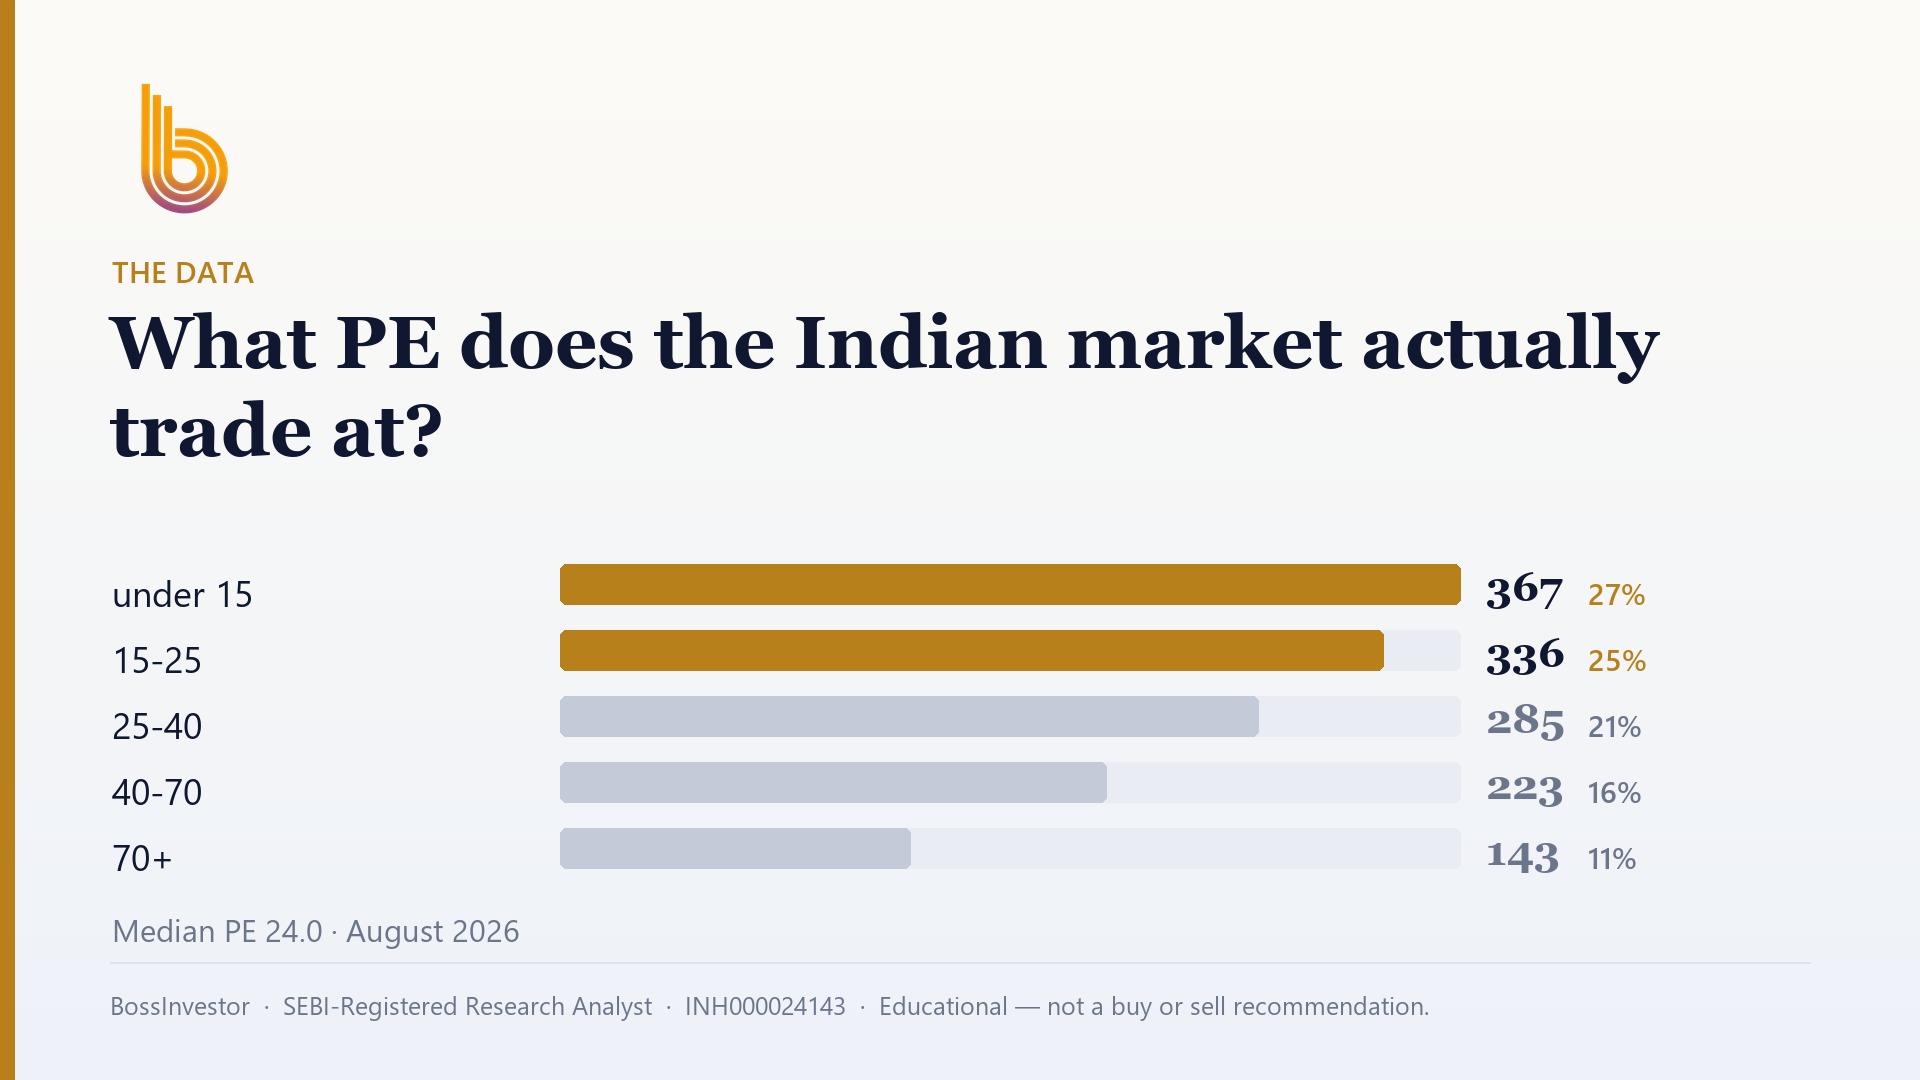
What counts as a reasonable PE ratio for an Indian stock?
There is no single good PE ratio. For Indian stocks, a useful anchor is our universe median PE of 24.0 as of August 2026. Below roughly 20 is cheap, 20 to 40 is normal, above 40 needs proof of growth. But PE only means something next to the company's growth, debt and return on capital.
Key Takeaways
- Median PE across our universe is 24.0 as of August 2026 — treat that as the middle of the road, not a target.
- 65.1% of Indian companies with full-year fundamentals trade at a PE between 0 and 40.
- A low PE is often a warning, not a discount — especially in cyclical businesses at peak profits.
- A high PE is only justified if profits are actually growing fast enough to catch up with it.
- Only 22.0% of companies clear ROE above 15%, ROCE above 15% and debt-to-equity under 1 together; 15.9% do that and stay under a PE of 40.
- Compare a stock's PE with its own history and its sector peers — never with a company from another industry.
What does the PE ratio actually tell you?
PE stands for price to earnings. You take the share price and divide it by the earnings per share for the last twelve months. To use an illustrative example: if a stock trades at ₹600 on the NSE and the company earned ₹30 per share last year, the PE is 20. That means you are paying ₹20 today for every ₹1 of annual profit the business currently makes.
There is a second way to read it that sticks better. A PE of 20 says that at today's profit level, the company would need twenty years of earnings to pay back what you paid for the share. A PE of 60 says sixty years. That is the whole idea. Everything else is detail.
The important thing is that PE has two moving parts — the price, which is decided by how people feel today, and the earnings, which are decided by how the business actually did. When a PE falls, it may be because the price dropped or because profits rose. Those are very different situations. Most bad decisions with PE come from not checking which one happened.
What is the average PE ratio in the Indian market right now?
From our own universe of 1,852 listed Indian companies, 1,518 have full-year fundamentals we can screen. As of August 2026, the median PE of that set is 24.0. So the typical Indian listed company is priced at roughly twenty-four times its annual profit. Half sit above that, half below.
Spread matters as much as the middle. As of August 2026, 988 of those companies — 65.1% — trade at a PE between 0 and 40. So a PE in the twenties or thirties is completely ordinary in India. It is neither a bargain nor a red flag on its own. Roughly a third of the market sits outside that band, either far cheaper or far more expensive, and that is where the questions get interesting.
Use 24.0 the way you would use the average height in a room — as an anchor for your eye, not as a rule. A PE of 15 tells you the market expects less from this business than from the average one. A PE of 70 tells you the market expects a lot more. Your job is to work out whether the market is right.
Is a low PE ratio always a sign that a stock is cheap?
No, and this is where most retail money in India gets lost. A low PE is the market's opinion, and quite often the market has a reason. Three reasons show up again and again.
The first is the cyclical trap. Metals, sugar, chemicals, shipping and commodity businesses earn enormous profits at the top of a cycle. Earnings spike, so the PE collapses to single digits, and the stock looks like a giveaway. Then the cycle turns, profits fall by half, and the same share price now carries a PE of 25. For cyclical companies, a low PE is often a sell signal in disguise. Long-term investors in these sectors usually look at price-to-book and where the commodity price sits, not PE.
The second is the one-off profit. If a company sold land, sold a subsidiary or booked an insurance settlement, that gain sits in the reported earnings and pushes the PE down artificially. Read the notes to accounts and strip out anything described as exceptional or other income. The third is governance and structure — high promoter pledging, weak disclosure, a tiny free float, related-party dealings, or a business the market simply does not trust. That discount can persist for a decade.
When is a high PE ratio justified?
A high PE is a bill you hand to the future. It is justified only when the profit is growing fast enough, and reliably enough, to pay that bill. Ask a plain question: how quickly do earnings have to grow before this looks ordinary?
Here is an illustrative calculation. A company trades at a PE of 60. If its profit grows 30% a year and the share price stays exactly flat, the PE falls to roughly 46 after one year, 35 after two, and 27 after three. In three years it has grown into a normal Indian valuation. Now take the same PE of 60 with profit growing at 8% a year. After three years the PE is still around 48. You did not buy growth, you bought a story.
So the test is simple. High PE plus high, durable growth plus a business that does not need constant fresh capital can be perfectly sensible. High PE plus modest growth is just an expensive stock. And be honest about durability — a single blockbuster year after a weak base is not a growth rate. Look at four or five years of profit, not one.
Why do PE ratios differ so much between sectors on the NSE and BSE?
Because the market pays for predictability. A consumer staples company selling soap and biscuits will earn something next year very close to what it earned this year. That reliability gets a premium, and these companies routinely trade well above the market median. A public sector bank, a steel maker or a construction firm has earnings that swing hard with interest rates, commodity prices and government spending. Uncertainty gets a discount.
Capital intensity is the other driver. A software services firm or an asset-light consumer brand can grow revenue without pouring money into new plants. A cement or power company has to spend heavily to grow at all, so less of the profit ever reaches the shareholder. The market notices, and prices it in.
The practical rule that follows: compare a stock's PE only against companies in the same industry, and against that same stock's own PE range over the last five years. A PE of 45 may be cheap for a business whose own five-year median is 60, and expensive for one whose median is 22. Cross-sector PE comparisons are the most common self-inflicted wound in Indian retail investing.
How should I use PE alongside ROE, ROCE and debt?
PE on its own tells you the price. It tells you nothing about what you are buying. Put it last, after three quality checks: return on equity, return on capital employed, and debt-to-equity. ROE and ROCE tell you whether the company earns a decent return on the money it uses. Debt-to-equity tells you how much of that is borrowed and how much trouble a bad year could cause.
Our numbers, as of August 2026, show how rare all of this is together. Of the 1,518 Indian companies with full-year fundamentals, 458 (30.2%) have ROE above 15% and 464 (30.6%) have ROCE above 15%. A comfortable 1,282 (84.5%) carry debt-to-equity below 1. But only 334 companies — 22.0% — clear all three at the same time. Add the valuation check of a PE under 40 and you are left with 241 companies, or 15.9% of the set.
One caveat before you screen. A flat debt-to-equity rule is unfair to banks and NBFCs, because borrowing money and lending it out is their entire business model, not a sign of stress. For lenders, look at capital adequacy, net interest margin, gross and net NPAs and price-to-book instead of forcing them through a debt screen built for manufacturers.
How do I check whether a stock's PE is reasonable, step by step?
Start with the right earnings number. Add up the last four quarters of consolidated net profit from the company's filings on the NSE or BSE website, not the standalone figure, so subsidiaries are included. Divide by the number of shares to get trailing twelve-month EPS. Then divide the current price by that. Screeners do this for you, but do it by hand once so you know what is inside the number.
Then run four comparisons. One, the stock's PE against its own median PE over the last five years. Two, against three or four listed peers in the same industry. Three, against the market median of 24.0 from August 2026. Four, against the company's own profit growth over four or five years.
An illustrative worked example: a mid-cap manufacturer trades at a PE of 32, its own five-year median PE is 21, peers sit between 18 and 25, and profits have grown around 10% a year. That is a stock priced for a much better future than it has delivered — not automatically a bad company, but you would want a specific reason to pay the premium. Reverse the figures — PE of 32 against a five-year median of 45, peers at 40 and profit growth of 20% — and the same number looks quite different.
What PE mistakes do Indian retail investors make most often?
Using PE where it does not apply. A loss-making company has no meaningful PE at all — the ratio is negative or simply blank, and no amount of staring at it will help. For banks and NBFCs, price-to-book usually says more. For real estate and infrastructure, the debt position and cash flow matter far more than the ratio.
Mixing up the versions. Trailing PE uses profits already reported. Forward PE uses somebody's estimate of next year's profit, and estimates are frequently wrong and usually optimistic. Two websites can show wildly different PEs for the same stock because one uses standalone earnings and the other consolidated. Check which one you are reading before you act on it.
And then the behavioural ones. Buying purely because a PE is the lowest in a sector, without asking why. Selling a quality compounder because its PE crossed some round number you picked. Churning in and out on small PE moves, which in India means short-term capital gains tax and brokerage eating the gain you were chasing. A ratio is a starting question, not a trigger.
Click Here – See BossInvestor's Data-Driven Stock Screens
Conclusion
A good PE ratio is the one that makes sense for that specific business, in that sector, at that point in its growth. Use 24.0 — our universe median as of August 2026 — as your anchor, then judge the stock against its own history, its peers and its actual profit growth. Quality first, price second: as of August 2026 only 15.9% of Indian companies with full-year fundamentals pass both a basic quality bar and a PE under 40. If you want to see which names currently sit in that filtered list, our research on the app is where the specific calls live, behind KYC.
BossInvestor is a SEBI Registered Research Analyst (INH000024143). This article is for educational and informational purposes only. It explains a method and is not investment advice, nor a recommendation to buy, sell or hold any security. Market-wide figures are computed from our universe as of August 2026; past metrics do not guarantee future results. Always do your own research or consult a registered adviser before investing.
Frequently Asked Questions
Is a PE of 15 good for an Indian stock?
It is below the median PE of 24.0 in our universe as of August 2026, so the market is pricing that business below average. Whether that is good depends entirely on why. If it is a steady, low-debt company with decent returns on capital that the market has simply ignored, 15 can be attractive. If it is a cyclical business at peak profits, or one with a governance shadow, 15 is the market warning you rather than offering you a discount.
What PE ratio is too high for an Indian stock?
There is no hard cut-off, but above 40 you have left the band where 65.1% of Indian companies with full-year fundamentals trade as of August 2026, so you should be able to defend the price. The test is arithmetic: at the company's actual profit growth rate, how many years before that PE looks ordinary? If the answer is more than three or four years, or the growth is not durable, you are paying for hope rather than earnings.
Should I compare PE ratios across different sectors?
No. Sector PE levels differ for structural reasons — predictability of earnings and how much capital the business needs to grow. Consumer and branded businesses carry structurally higher PEs than metals, public sector banks or construction, and that gap does not close just because you noticed it. Compare a stock only with peers in its own industry and with its own PE range over the last five years. Cross-sector PE comparison is one of the most common and expensive retail errors.
Does PE work for banks and NBFCs in India?
Only partly. PE is usable for lenders, but it is not the primary lens. Price-to-book, along with return on assets, net interest margin, capital adequacy and gross and net NPAs, tells you far more. A related point: a flat debt-to-equity screen unfairly penalises banks and NBFCs, because borrowing is their business model rather than a sign of financial stress. If you screen the market on debt, exclude lenders and judge them on their own metrics.
What is the difference between trailing PE and forward PE?
Trailing PE uses the profit the company has already reported over the last twelve months. It is a fact. Forward PE uses an analyst's estimate of next year's profit, so it is a forecast, and forecasts are frequently optimistic. Forward PE always looks cheaper for a growing company, which is exactly why it gets quoted in sales pitches. Start with trailing PE on consolidated earnings, use forward PE as a cross-check, and never mix the two when comparing stocks.
Related Blogs
How to Analyse a Stock Before Buying: A 10-Point Checklist
Published: Mon Sep 07 2026Read more…

How to Calculate Your Financial Freedom Number and Achieve It
Published: Tue May 20 2025Read more…
 (1).jpg)
From Signal to Strategy: The Moving Averages
Published: Tue May 20 2025Read more…

Market Share: The Silent Signal of Competitive Power and Investment Opportunity
Published: Wed May 14 2025Read more…