What is a good PEG ratio?
The PEG ratio is the one number that tries to answer whether a stock is expensive relative to how fast it is growing. This page shows you the exact formula, the range that actually works in Indian markets, and the three ways a low PEG lies to you.

BOSSINVESTOR
Mon Sep 07 2026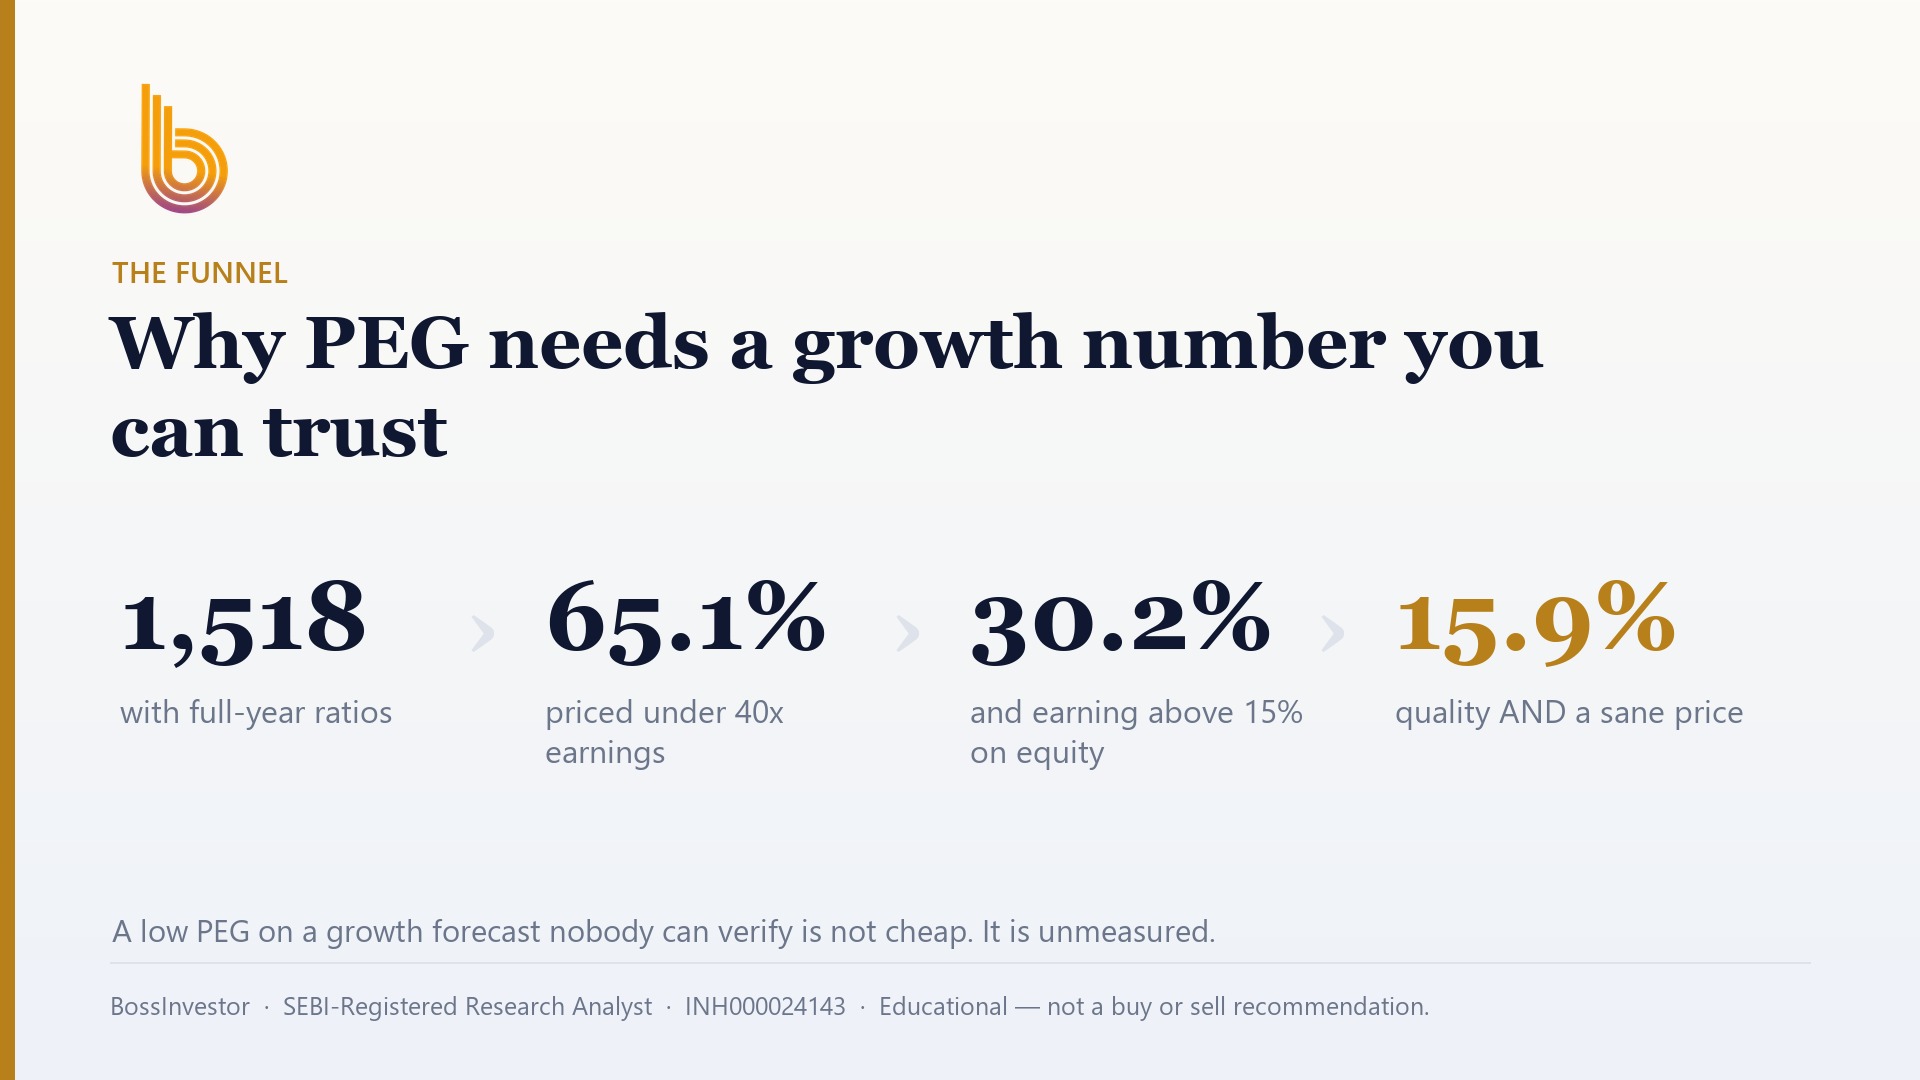
What counts as a good PEG ratio for an Indian stock?
A PEG ratio under 1 is treated as cheap, 1 to 1.5 as fair, and above 2 as expensive. For Indian stocks, 1.0 to 1.5 is the realistic good zone for a quality business. With the median PE at 24.0 in our universe as of August 2026, a PEG of 1 demands 24% sustained earnings growth — rare.
Key Takeaways
- PEG = PE ratio divided by the annual earnings growth rate, written as a plain number.
- Under 1 is cheap, 1 to 1.5 is fair, over 2 is expensive — but only if the growth number is honest.
- Median PE in our universe is 24.0 as of August 2026, so PEG of 1 needs roughly 24% growth every year.
- Most PEG values below 0.5 come from a collapsing price or a one-off profit, not a bargain.
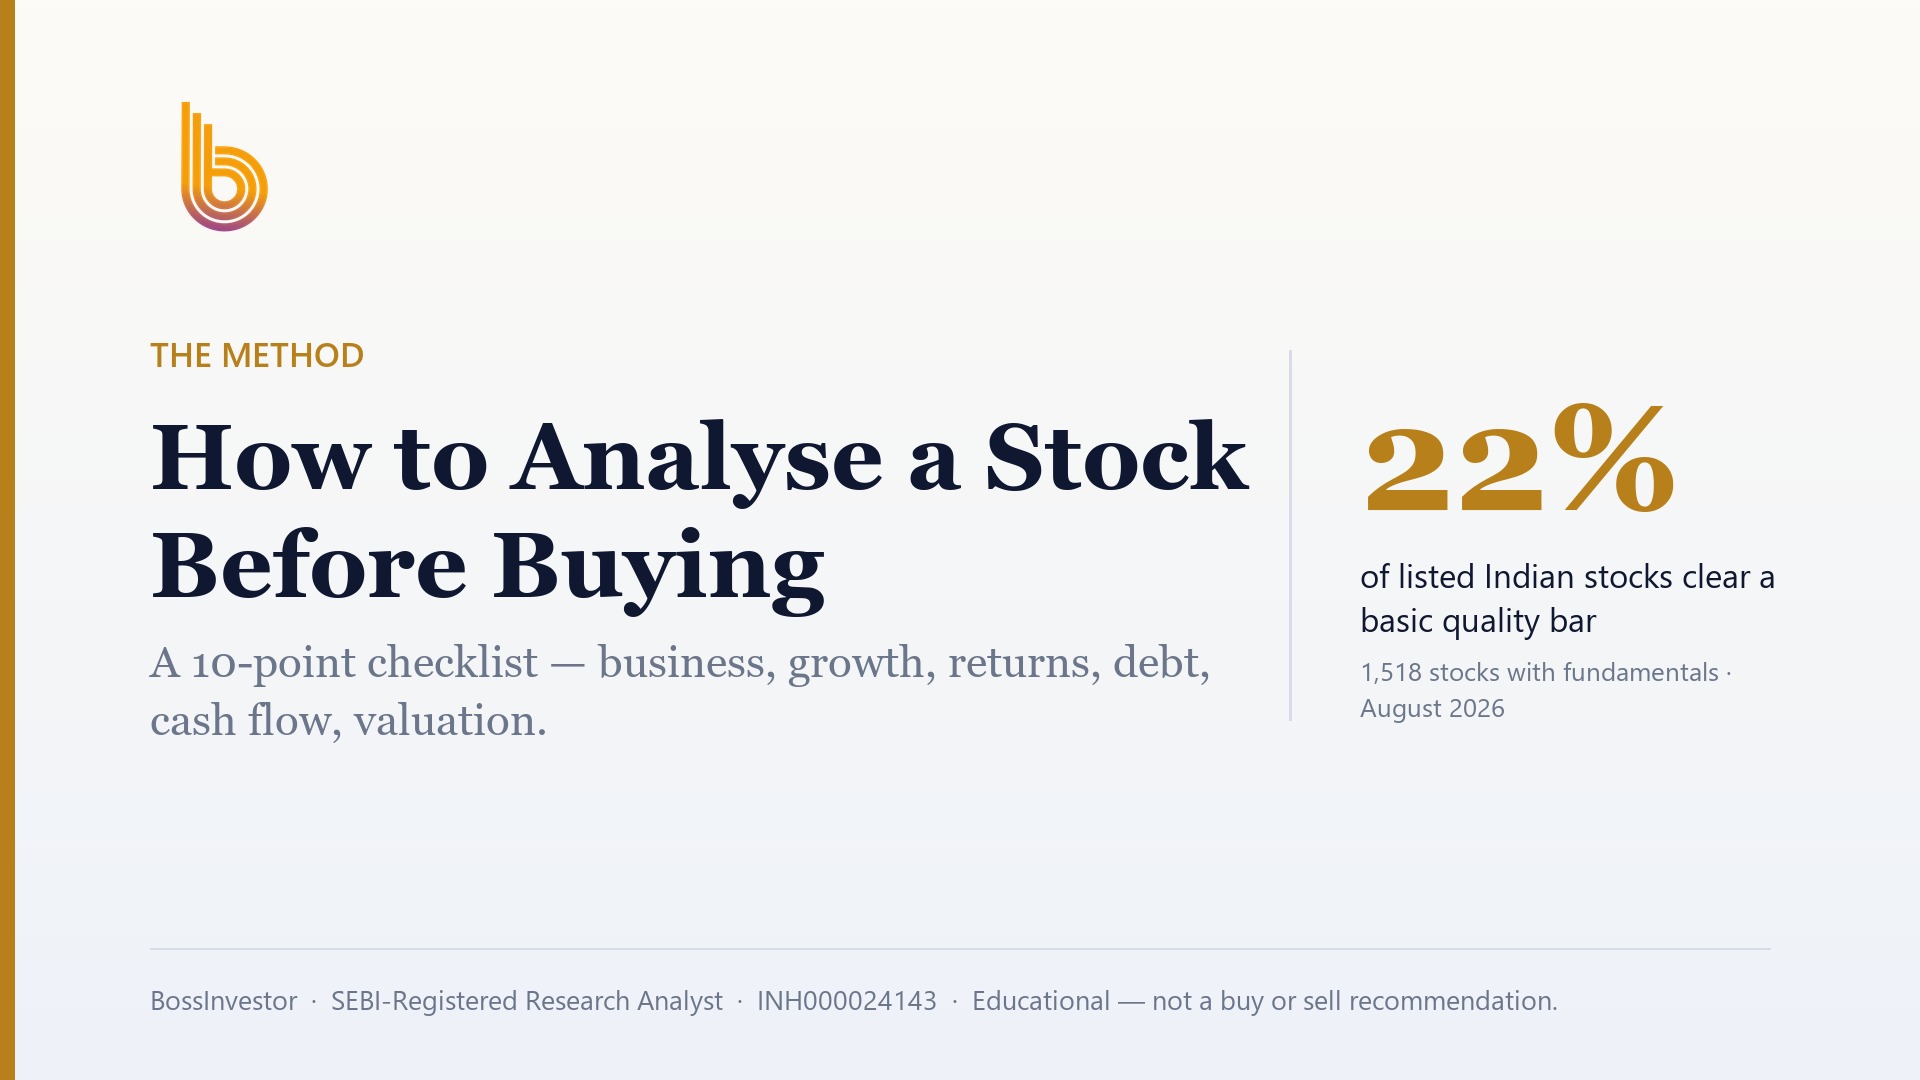
- Only 22.0% of 1,518 companies with full-year fundamentals clear a basic quality bar as of August 2026 — check quality before you check PEG.
- PEG is close to useless for banks, NBFCs and commodity cyclicals.
What does the PEG ratio actually measure?
The PE ratio tells you how many rupees you are paying for one rupee of annual profit. It is useful, but it is blind in one important way: it does not know whether that profit is growing, flat, or shrinking. A company earning the same profit for ten years and a company doubling profit every three years can both trade at a PE of 30. The PE alone cannot separate them.
The PEG ratio was built to fix exactly that. You take the PE ratio and divide it by the expected annual earnings growth rate, written as a plain number. A stock at a PE of 40 growing profits at 40% a year has a PEG of 1. A stock at a PE of 20 growing at 20% also has a PEG of 1. The ratio is saying: on this measure, you are paying the same price for growth in both cases.
So PEG is not a valuation ratio in the normal sense. It is a fairness check. It asks whether the premium the market has put on a business is roughly matched by the speed at which that business is compounding. That is a genuinely useful question. It is also a ratio built on top of another ratio, which means it inherits every weakness of both — and adds one of its own, because the growth number is a guess.
How do you calculate PEG for a stock listed on the NSE or BSE?
Three steps. First, get the PE: share price divided by earnings per share for the last twelve months. Every NSE and BSE quote page carries this. Second, get an annual earnings growth rate as a percentage — most people use the three-year or five-year growth rate in net profit or EPS. Third, divide the first number by the second.
An illustrative example, with made-up figures purely to show the arithmetic: a share trades at ₹600 and earned ₹20 per share over the last year. Its PE is 600 ÷ 20 = 30. Suppose profit has grown roughly 20% a year over five years and the business looks capable of continuing at that pace. The PEG is 30 ÷ 20 = 1.5. Now change one thing: if growth had been 12% instead of 20%, the same ₹600 share would carry a PEG of 2.5 — the price did not move, but the verdict flipped.
That sensitivity is the whole point and the whole danger. Nudging the growth assumption from 12% to 20% is easy to do in your head and completely changes the answer. Always write down where your growth number came from before you divide. If you cannot name the source and the period, you do not have a PEG ratio, you have a wish.
Is a PEG below 1 always better than a PEG above 1?
No, and this is where most retail investors get hurt. The textbook rule says below 1 is undervalued, around 1 is fair, above 2 is overvalued. In practice, in Indian markets, a PEG comfortably below 1 on a genuinely good business is uncommon. When you find one, the first assumption should be that something is wrong with the inputs, not that you have found a bargain the market missed.
There are three usual culprits. One, the earnings are inflated by a one-time item — a land sale, an insurance receipt, a tax writeback — which pushes EPS up, drags PE down, and makes PEG look tiny. Two, the growth number is measured from a collapsed base year, so a recovery back to normal reads as 60% growth. Three, the share price has fallen hard because the market has already decided the growth is ending, which is the market pricing in the future while your PEG is still reading the past.
A more useful way to hold it: treat 1.0 to 1.5 as the fair zone for a high-quality, low-debt business with visible growth. Treat 0.5 to 1.0 as interesting but requiring you to explain why it is cheap. Treat below 0.5 as a red flag to investigate, not a green light. And treat above 2 as a stock where you are paying for growth that must not only arrive but arrive early.
Which growth rate should go in the denominator — past or projected?
Both are used, and they answer different questions. Past growth — the three or five year profit growth rate — is a fact. You can verify it from the annual reports. Its weakness is obvious: the past does not have to repeat, and a company that grew fast for five years is often the company most likely to slow down next.
Forward growth — what analysts expect over the next one to three years — is what the market is actually pricing. Its weakness is equally obvious: it is an opinion, and opinions cluster. When everyone is optimistic, forward growth estimates are high, PEG looks low, and the ratio quietly tells you to buy at the top.
The practical answer is to calculate both and take the lower one. If past growth is 25% and forward expectations are 15%, use 15%. You are choosing to be paid for optimism rather than to pay for it. And for anything cyclical, stretch your growth window to cover a full up-and-down cycle — a five-year window that only contains the good half of a cycle is not a growth rate, it is a highlight reel.
Why does the median Indian PE make a PEG of 1 so hard to find?
Here is the arithmetic that most PEG articles skip. Across our universe of 1,852 listed companies, the median PE is 24.0 as of August 2026. Run that through the formula: for a typical Indian stock to show a PEG of 1, it needs to grow earnings at roughly 24% a year. Not for one year. Sustainably, over the period you intend to hold it.
Very few businesses compound profit at 24% for long stretches. That is why, in a market priced where ours is, a PEG of 1 is not a normal outcome — it is an exception you should be able to justify with a specific reason: a genuine capacity expansion, a structural shift in demand, a new product cycle. If you cannot name the engine, the growth number is probably borrowed from a base effect.
This also explains why so many quality Indian stocks look permanently expensive on PEG. They are not mispriced. The market has correctly recognised a durable business and priced it at a PE that a realistic growth rate cannot rescue. Your job then is not to hunt for a PEG under 1, but to decide the highest PEG you are willing to pay for that particular quality of business — and to write it down before the price moves.
Does PEG work for banks, NBFCs and cyclical companies?
Badly, in both cases, and for different reasons. For banks and NBFCs, earnings growth swings with the credit cycle and with provisioning decisions that management has real discretion over. A year of low provisions can produce dazzling profit growth that has nothing to do with the underlying lending business. Analysts generally look at price-to-book alongside return on equity for lenders rather than leaning on PEG.
There is a related trap worth naming. Any screen that filters on debt-to-equity unfairly punishes banks and NBFCs, because borrowing money is literally their business model, not a sign of stress. In our universe, 84.5% of companies with full-year fundamentals carry debt-to-equity below 1 as of August 2026 — a healthy-looking number, but if you apply that filter blindly you will throw out most of the financial sector for no good reason. Judge lenders on capital adequacy and asset quality instead.
Commodity and deep-cyclical businesses — metals, sugar, shipping, chemicals — break PEG the other way. At the top of a cycle their PE looks low and their recent growth looks enormous, so PEG reads as absurdly cheap right at the moment of maximum danger. At the bottom, earnings collapse, PE goes to infinity or negative, and PEG cannot be computed at all. For these, cycle-average earnings are far more informative than any PEG value.
What should you check before you trust a low PEG?
Quality first, price second. A cheap PEG on a weak business is not an opportunity, it is a bill you pay later. The order matters: establish that the business earns good returns on the capital it employs and is not carrying dangerous debt, and only then ask whether the price is fair relative to growth.
The screening reality is sobering. Of the 1,518 listed Indian companies in our universe with full-year fundamentals, only 22.0% clear a basic quality bar of return on equity above 15%, return on capital employed above 15%, and debt-to-equity below 1, all at the same time, as of August 2026. Add a simple valuation check — PE under 40 — and you are left with 15.9%. Roughly one company in six on the whole exchange passes a first-round filter that is not even demanding.
So run your PEG calculation on that shortlist, not on the whole market. Then check three things by hand. Are the last four quarters of profit free of one-time items? Is cash flow from operations tracking reported profit reasonably closely, or is the profit only on paper? And has promoter shareholding been stable rather than steadily falling? A low PEG that survives all three is worth your attention. One that fails any of them was never really low.
What mistakes do retail investors make most often with PEG?
The first is treating PEG as a single-number verdict. It is a screening aid that narrows a list of two thousand names to a list of thirty. It was never designed to make the final decision, and using it that way is how people end up holding a portfolio of statistically cheap, fundamentally broken companies.
The second is copying whatever PEG figure a website displays without checking the growth period behind it. Different sites use different windows — one year, three years, five years, forward estimates — and they produce wildly different answers for the same stock. Compute it yourself at least once for any company you are serious about.
The third is comparing PEG across unrelated sectors. A software services company, a cement maker and a jewellery retailer have different capital needs, different working capital cycles and different growth ceilings. Comparing their PEG numbers side by side tells you almost nothing. Compare within a sector, against direct competitors.
The fourth is forgetting your holding period. PEG implicitly assumes you will hold long enough for the growth to actually show up in the price. If you are trading in and out over weeks, the ratio has no bearing on your outcome — and in India, exiting quickly also means your gains are taxed at the higher short-term rate rather than the lower long-term one, which quietly eats the edge you were trying to capture.
Click Here – See BossInvestor's Data-Driven Stock Screens
Conclusion
A good PEG ratio for an Indian stock is usually 1.0 to 1.5 on a business that is already high quality — and with the median PE at 24.0 as of August 2026, anything much below 1 deserves suspicion rather than excitement. Compute it yourself, use the lower of past and expected growth, and never apply it to lenders or deep cyclicals. Get the method right and the ratio becomes a filter that saves you time. When you want to know which specific names currently clear these filters in our tracked universe, that screen sits inside the BossInvestor app after KYC.
BossInvestor is a SEBI Registered Research Analyst (INH000024143). This article is for educational and informational purposes only. It explains a method and is not investment advice, nor a recommendation to buy, sell or hold any security. Market-wide figures are computed from our universe as of August 2026; past metrics do not guarantee future results. Always do your own research or consult a registered adviser before investing.
Frequently Asked Questions
Is a PEG ratio of 0.5 a good buy signal?
Rarely, on its own. A PEG of 0.5 means the market is pricing the stock at half the growth rate it is currently showing, which usually happens for a reason. The three common causes are a one-time item inflating last year's profit, a growth rate measured from an unusually weak base year, or a falling share price because investors expect the growth to stop. Investigate all three before treating it as cheap. If none of them explain it, then it may genuinely be mispriced.
What is the difference between PE and PEG?
PE tells you the price you are paying for one rupee of current annual profit. PEG divides that PE by the earnings growth rate, so it tells you the price you are paying for one unit of growth. PE is a fact you can verify from the price and the last annual report. PEG contains a forecast, because growth is an assumption about the future. That makes PEG more informative when the growth number is honest, and more misleading when it is not.
Can the PEG ratio be negative?
Yes, and a negative PEG is meaningless rather than attractive. It happens when either earnings are negative — making the PE negative — or when the growth rate is negative because profits are shrinking. In both cases the arithmetic still produces a number, but it carries no information about value. Screening tools sometimes sort these to the top of a cheap list, which is why blindly sorting by PEG is dangerous. Filter out loss-making and profit-declining companies before you rank anything by PEG.
What PEG ratio do Indian small-cap stocks usually trade at?
There is no single reliable figure, because small-cap earnings are volatile enough that the growth rate in the denominator swings dramatically from year to year. The same small-cap can show a PEG of 0.6 one year and 3.0 the next without the business changing much at all. For smaller companies, use a longer growth window covering a full business cycle, and lean more on cash flow and debt levels than on any valuation ratio. PEG works best on businesses with stable, predictable earnings.
Should I use PEG or ROCE to pick stocks?
Use both, in that order: quality first, then price. Return on capital employed tells you whether the business generates good profit from the money it uses, which is a property of the company itself. PEG tells you whether the market's price is fair given the growth, which is a property of the price. A high-ROCE business at a stretched PEG may still be worth owning. A low-ROCE business at an attractive PEG usually is not, because the cheapness is compensation for a weak underlying business.
Related Blogs
How to Analyse a Stock Before Buying: A 10-Point Checklist
Published: Mon Sep 07 2026Read more…

How to Calculate Your Financial Freedom Number and Achieve It
Published: Tue May 20 2025Read more…
 (1).jpg)
From Signal to Strategy: The Moving Averages
Published: Tue May 20 2025Read more…

Market Share: The Silent Signal of Competitive Power and Investment Opportunity
Published: Wed May 14 2025Read more…