What is a good operating and net profit margin?
Margins are the easiest number to look up and the easiest to misread. This page explains what operating margin and net margin actually measure, how to judge them for an Indian company, and how to tell a real margin from a cosmetic one. Method only — no stock calls.

BOSSINVESTOR
Mon Sep 07 2026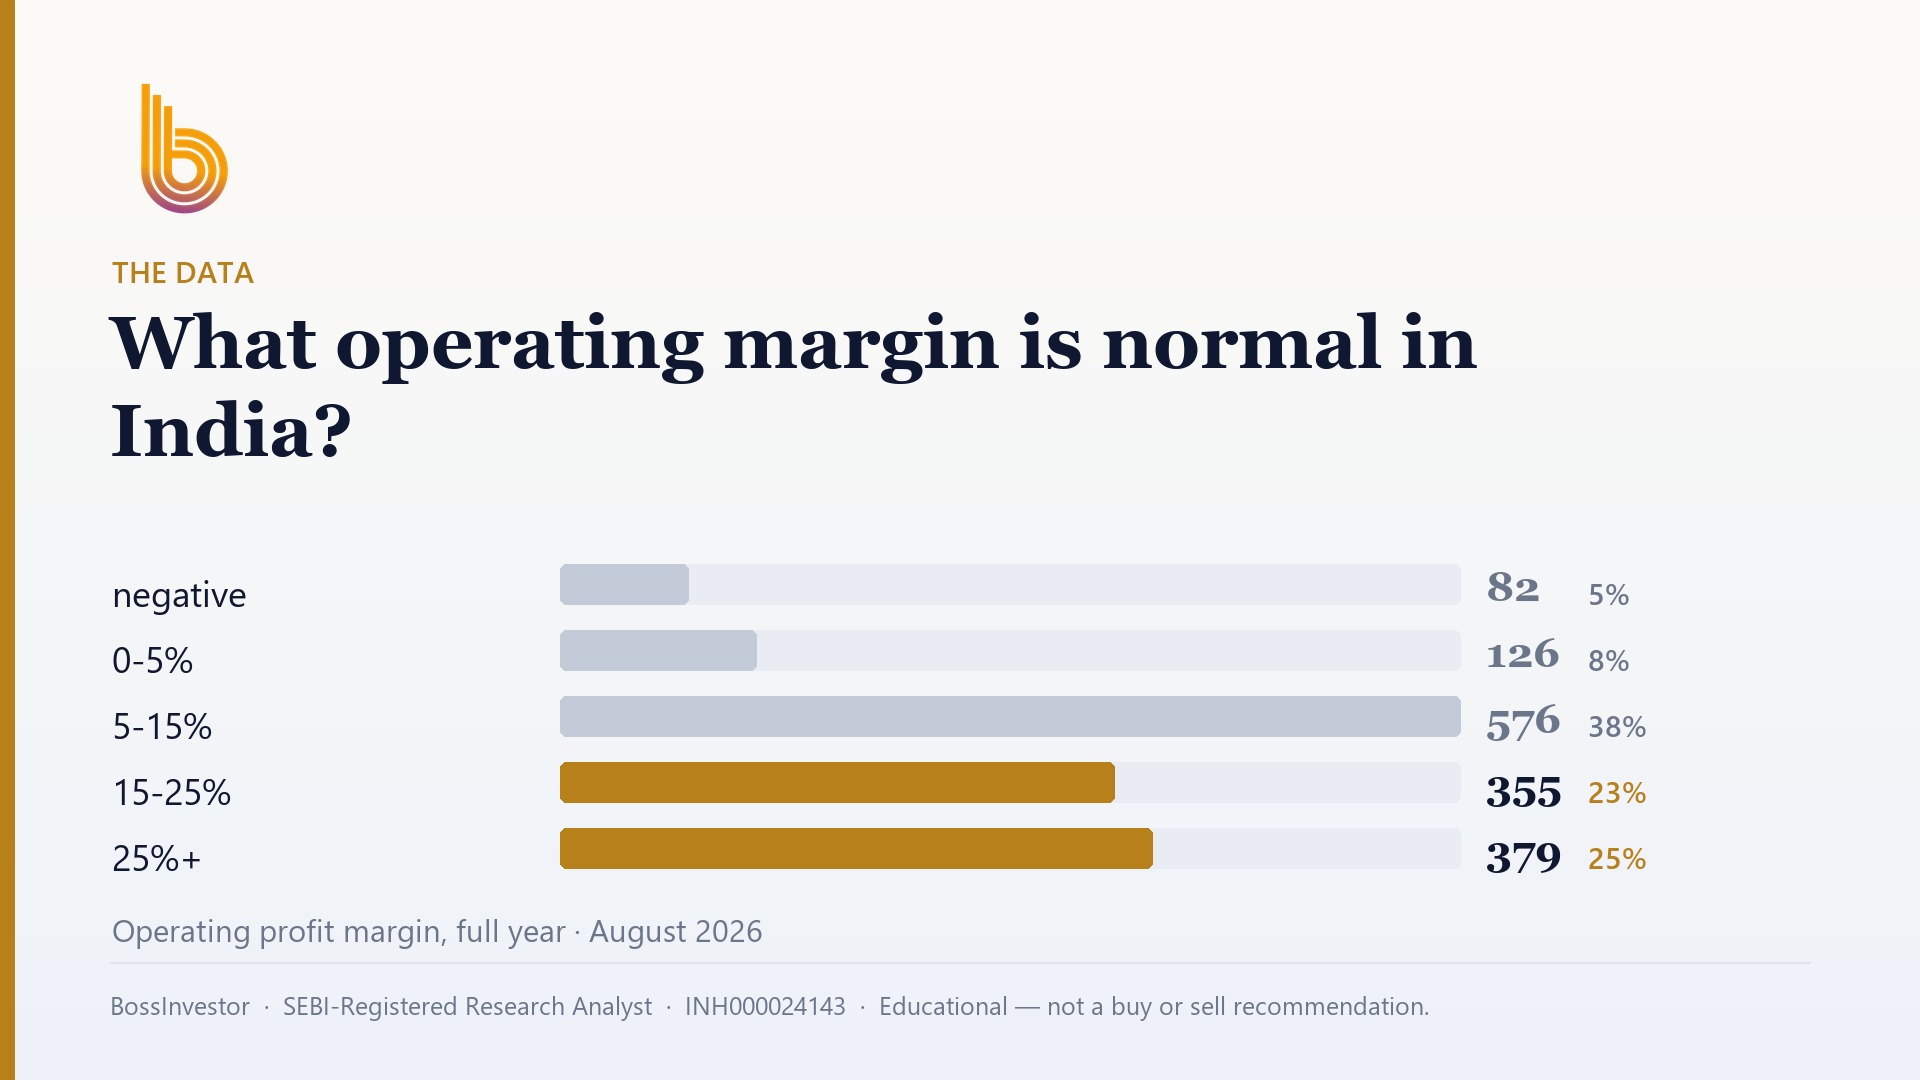
What margin level should an Indian retail investor treat as good?
There is no single good margin — it depends on the industry. As a working rule, judge an Indian company's operating margin against its own listed peers and its own five-year record, not against the market. A high net margin means little on its own; what matters is whether margins are stable or rising, and whether the profit shows up as cash.
Key Takeaways
- Operating margin shows what the core business earns; net margin shows what survives interest, depreciation and tax.
- Margins are only comparable inside an industry — a software firm and a rice miller are different animals.
- A thin margin is fine if the company turns its capital over quickly; look at ROCE, not margin alone.
- A margin that jumps on other income, a land sale or a tax change is not a business improvement.
- Direction and stability over five to ten years beat a single high number in one quarter.
- Margins are a filter, not a verdict — pair them with return on capital, debt and valuation.
What is the difference between operating margin and net profit margin?
Operating margin is operating profit divided by revenue. Operating profit is what the business earns from selling its product or service, before interest on borrowings, before any income from parking money in fixed deposits or mutual funds, and before tax. In Indian annual reports and on most screeners you will see it as EBITDA margin (before depreciation) or EBIT margin (after depreciation). Both are fine as long as you use the same one for every company you compare.
Net profit margin is profit after tax divided by revenue. It is everything: the core business, plus interest paid, plus other income, minus depreciation, minus tax, plus or minus one-off items like the sale of a factory or a written-back provision.
The gap between the two tells you a story on its own. A company with a healthy operating margin but a poor net margin is usually paying heavy interest on debt, or carrying heavy depreciation from a recent capex round. A company whose net margin looks better than its operating margin is often earning a lot from something other than its business. Neither is automatically bad. But you should know which one you are buying.
What counts as a good operating profit margin for an Indian company?
The honest answer is: good compared to what? A branded consumer goods company, a listed hospital chain, an IT services exporter, a steel roller and a commodity trader all live at completely different margin levels, and always will. Ranking them against each other on a single margin number is meaningless.
So use two comparisons instead of a fixed threshold. First, peers. Pick three or four companies listed on the NSE or BSE that actually do the same thing, and put their operating margins side by side for the same financial year. The question you are answering is not "is 14% good?" but "why does this company earn 14% when the other three earn less — and can it keep doing that?" A durable gap over peers usually means pricing power, a brand people ask for by name, a distribution network that is hard to copy, or a cost structure others cannot match.
Second, its own history. Pull the same margin for the last five to ten years. A company that has held its operating margin through a raw-material spike and a demand slowdown has proven something. A company whose margin swings wildly every second year is telling you it is a price-taker, not a price-setter.
What is a good net profit margin, and when is a thin one perfectly fine?
Thin net margins scare retail investors more than they should. Grocery retail, jewellery, auto dealerships, pharma distribution and electronics trading all run on slim net margins by design. That is not a flaw in the business — it is the business.
The reason a thin margin can still be excellent is turnover. Return on capital is roughly margin multiplied by how many times a year the company turns its capital into sales. A jeweller earning a small net margin but rotating inventory several times a year can generate a better return on capital than a plant-heavy manufacturer earning a fat margin on capital that turns over slowly.
So the practical rule is this. Do not ask whether the net margin is high. Ask whether the combination of margin and turnover produces a good return on capital employed, and whether the company can grow without constantly raising fresh money. A thin margin becomes a genuine problem only when it is also falling, or when it is so thin that one bad quarter of raw-material prices wipes out the profit entirely.
How do I calculate operating and net margin from an Indian annual report?
Open the consolidated profit and loss statement, not the standalone one. Consolidated numbers include subsidiaries, and for most Indian groups that is where the real business sits. Mixing standalone figures for one company with consolidated for another is one of the most common errors retail investors make.
Take revenue from operations as your denominator — not total income, because total income includes other income. Then take operating profit as revenue from operations minus cost of materials, employee cost and other expenses. Divide, and you have operating margin. For net margin, take profit after tax attributable to owners and divide it by the same revenue from operations.
Here is a purely illustrative example, with made-up figures used only to show the arithmetic. Suppose a company reports revenue from operations of ₹1,000 crore, operating profit of ₹180 crore, other income of ₹20 crore, interest of ₹40 crore, depreciation of ₹50 crore and profit after tax of ₹85 crore. Operating margin is 180 divided by 1,000, or 18%. Net margin is 85 divided by 1,000, or 8.5%. Notice that a good chunk of what reached the bottom line came from interest costs and depreciation, and that ₹20 crore of the profit was not from selling anything at all.
Why can a high margin still be a bad sign?
Margins can be flattered, and a lot of them are. Watch for four things. One, other income doing the heavy lifting — treasury gains, interest on deposits, a foreign exchange gain. Two, a genuine one-off, like selling land or a division, sitting inside the reported profit and making one year look permanently better. Three, a change in the tax rate, such as a company shifting to a lower concessional corporate tax regime, which lifts net margin without a single thing improving inside the business. Four, expenses being capitalised rather than charged to the profit and loss, which quietly moves cost off the income statement and onto the balance sheet.
The single best cross-check is cash. Compare cash flow from operations with reported operating profit over five years, not one. If profits are rising and operating cash flow is not keeping pace, the margin is being earned on paper — usually because receivables or inventory are ballooning. Sales booked to distributors who have not paid yet are still sales in the P&L.
Ask one more question: is the margin funded by underinvestment? A company can lift margins for two or three years by cutting advertising, maintenance or research. It looks like efficiency. It is usually borrowing from the future.
Do the same margin rules apply to banks, NBFCs and IT companies?
No, and this trips up a lot of first-time screeners. For a bank or an NBFC, "revenue" is interest income, and an operating margin on that number tells you almost nothing. The relevant measures there are net interest margin, cost-to-income ratio, credit costs and asset quality. A lender with a great-looking margin and a rising bad-loan book is not a good business.
The same caution applies to any debt filter you run alongside margins. A flat debt-to-equity rule unfairly penalises banks and NBFCs, because borrowing money and lending it out at a higher rate is literally their business model. If your screen throws out every lender, that is the screen's limitation, not a verdict on the sector — judge lenders on capital adequacy and asset quality instead.
IT services and other asset-light businesses sit at the other extreme. They carry little debt and modest depreciation, so operating and net margins tend to run close together, and small shifts in employee cost, utilisation or the rupee move the margin visibly. There, a one-percentage-point move is meaningful news, not noise.
Is a rising margin better than a high margin?
Usually, yes — provided the rise is real and explainable. A margin that has climbed steadily over several years because of a better product mix, more premium products, scale in manufacturing or a shift towards services often signals a business that is getting stronger. The market tends to pay for that direction long before the number itself looks impressive.
The reverse deserves equal attention. A company growing revenue fast while its operating margin slides is buying that growth — through discounts, higher advertising spend, or entry into a lower-margin segment. Sometimes that is a deliberate, sensible land-grab. Sometimes it is competition quietly eating the business. Reading the management commentary and the segment disclosures is how you tell the two apart.
One practical habit: track margins quarterly for the trend and annually for the judgement. Quarterly data catches turns early, but Indian quarterly numbers are seasonal and often unaudited, so never form a view on one quarter alone.
How do margins fit with return on capital, debt and valuation when screening stocks?
Margin is one input, not a conclusion. Profitability, efficiency, balance-sheet safety and price all have to line up, and very few companies clear all of them at once. From our own universe of 1,852 listed Indian companies as of August 2026, 1,518 had full-year fundamentals available. Of those, only 22.0% cleared a basic quality bar of return on equity above 15%, return on capital employed above 15% and debt-to-equity below 1 — all three at the same time. Add a simple valuation check of a price-to-earnings ratio under 40 and just 15.9% survive. For context, the median PE across that universe was 24.0.
Read that carefully, because it reframes the margin question. Roughly four out of five listed Indian companies fail a plain quality test before you have even looked at price. So a strong margin is not an edge by itself — it is one of several conditions that must hold together. And remember the caveat above: the debt-to-equity leg of that screen is unfair to banks and NBFCs, so those need a separate lens.
A workable sequence for a retail investor: start with return on capital employed to find businesses that actually earn on the money they use, then look at operating margin and its trend to understand where that return comes from, then check debt and cash conversion to see whether it is safe, and only then look at the price. Margins tell you the character of the business. They do not tell you whether today's price is sensible.
What mistakes do retail investors make when comparing margins?
The five most expensive ones are easy to fix. Comparing across industries — a 4% net margin in distribution and a 4% net margin in specialty chemicals mean completely different things. Mixing standalone and consolidated numbers between two companies. Judging on a single quarter, especially a festive or monsoon-affected one. Treating EBITDA margin as if it were cash profit, when it sits above interest, depreciation and tax. And extrapolating a recent margin expansion forward for a decade, which is exactly the assumption that makes an expensive stock look cheap on a spreadsheet.
There is a sixth, subtler one: assuming a high margin is protected. Ask what stops a competitor from undercutting this company. If the answer is a brand people ask for, a regulatory approval, a distribution network, switching costs or genuine scale, the margin has a moat. If the answer is "nothing yet," the margin is a temporary condition, and it will be competed away.
Click Here – See BossInvestor's Data-Driven Stock Screens
Conclusion
There is no magic margin number, and anyone who gives you one is selling something. The method is what travels: compare within the industry, compare against the company's own multi-year record, check that reported profit converts into operating cash, and treat margin as one leg of a stool that also includes return on capital, debt and price. Do that consistently and you will filter out most of the market before you ever look at a chart. When you want the shortlist and the actual calls that come out of this framework, those sit behind KYC inside the BossInvestor app, as required of a SEBI-Registered Research Analyst (INH000024143).
BossInvestor is a SEBI Registered Research Analyst (INH000024143). This article is for educational and informational purposes only. It explains a method and is not investment advice, nor a recommendation to buy, sell or hold any security. Market-wide figures are computed from our universe as of August 2026; past metrics do not guarantee future results. Always do your own research or consult a registered adviser before investing.
Frequently Asked Questions
Is operating margin or net profit margin more important?
Operating margin is the better read on the business itself, because it strips out interest, other income and tax. Net margin tells you what actually reaches shareholders after everything. Look at both, then look at the gap between them. A wide gap usually points to a heavy interest burden or heavy depreciation from recent capex. A net margin that consistently exceeds what the operating business can explain usually points to income earned outside the core operations.
Can a company with a low net profit margin still be a good investment?
Yes. Return on capital depends on margin multiplied by how fast capital turns into sales. Retailers, distributors, jewellers and dealership businesses run thin net margins but rotate inventory and capital quickly, which can produce strong returns on the money employed. The low margin becomes a real risk only when it is also falling, or when it is so thin that a modest rise in input costs or one bad quarter erases the profit entirely.
Should I use standalone or consolidated figures to calculate margins?
Use consolidated. Most Indian listed groups run meaningful operations through subsidiaries and joint ventures, and standalone numbers can miss both the profits and the debt sitting there. The one rule that matters more than which you pick is consistency: never compare one company's standalone margin with another's consolidated margin, and never switch between the two across years for the same company. If you switch, your entire trend line becomes meaningless.
How many years of margin history should I look at?
At least five years, and ten if the data is available, so that your view covers a full demand cycle and at least one raw-material shock. One year tells you almost nothing, and a single quarter is often just seasonality. Use annual audited numbers to form the judgement and quarterly numbers only to spot a turn early. Stability across a difficult period is stronger evidence of a durable business than a high number in a good year.
Do margin rules work for banks and NBFCs?
Not in the same form. For lenders, interest income is not comparable to a manufacturer's revenue, so an operating margin on it is not informative. Use net interest margin, cost-to-income ratio, credit costs and asset quality instead. The same caution applies to debt screens: a flat debt-to-equity limit unfairly penalises banks and NBFCs, because borrowing is their business model, not a warning sign. Judge them on capital adequacy and loan-book quality.
How much of the Indian market actually passes a basic quality screen?
Less than most people expect. From our universe of 1,852 listed Indian companies as of August 2026, 1,518 had full-year fundamentals. Only 22.0% of those cleared return on equity above 15%, return on capital employed above 15% and debt-to-equity below 1 simultaneously. Adding a price-to-earnings check under 40 leaves 15.9%. The median PE across that universe was 24.0. So a good margin is a starting filter, never a conclusion on its own.
Related Blogs
How to Analyse a Stock Before Buying: A 10-Point Checklist
Published: Mon Sep 07 2026Read more…

How to Calculate Your Financial Freedom Number and Achieve It
Published: Tue May 20 2025Read more…
 (1).jpg)
From Signal to Strategy: The Moving Averages
Published: Tue May 20 2025Read more…

Market Share: The Silent Signal of Competitive Power and Investment Opportunity
Published: Wed May 14 2025Read more…