Which financial ratios matter most for stock picking?
Most investors either ignore ratios entirely or drown in forty of them. This page cuts the list down to the handful that actually change a decision, explains what each one is really telling you, and shows the order to apply them in. Plain language, Indian market context, no stock tips.

BOSSINVESTOR
Mon Sep 07 2026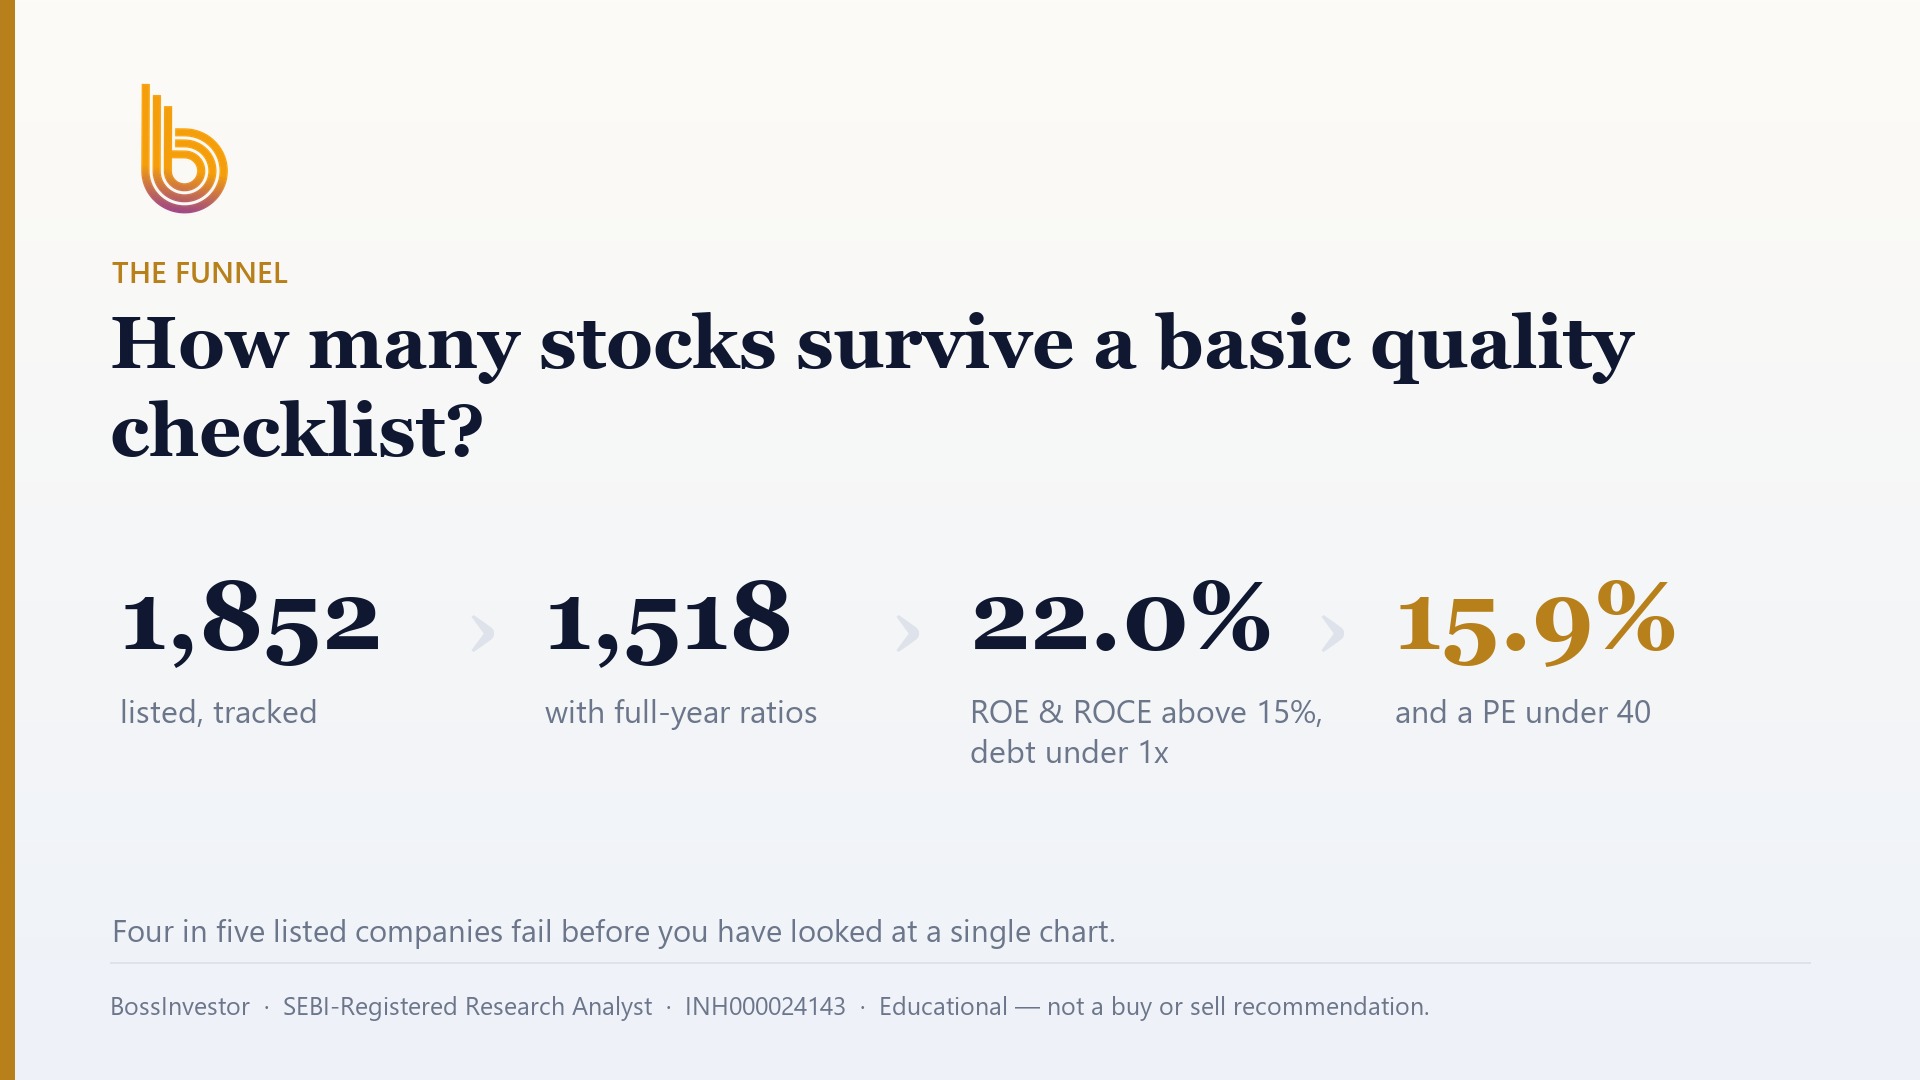
Which numbers should an Indian investor check before buying any stock?
Five ratios do most of the work: ROE, ROCE, debt-to-equity, PE and free cash flow versus profit. Check quality first, price second. In our universe of 1,518 Indian companies with full-year fundamentals (August 2026), only 22.0% clear ROE above 15%, ROCE above 15% and debt-to-equity below 1 together.
Key Takeaways
- ROCE is the honest quality test; ROE can be inflated by borrowing.
- Only 22.0% of 1,518 Indian companies pass ROE, ROCE and debt together (August 2026).
- Median PE in our universe is 24.0, so a PE of 24 is ordinary, not cheap.
- Compare five years of a ratio, never one — the trend matters more than the level.
- Banks and NBFCs need a completely different panel; debt-to-equity is meaningless for them.
- Screen on quality first and price last, or you will buy cheap businesses that stay cheap.
What does ROE actually tell you about a company?
ROE tells you what the company earns on the money that belongs to shareholders. Take net profit for the full year and divide it by shareholders' equity — share capital plus reserves. If a business runs on ₹100 crore of shareholders' money and earns ₹18 crore of profit, ROE is 18%. That is the compounding engine. A company that keeps earning 18% and reinvests most of it grows its book value fast, and share prices eventually follow book value plus growth. A company earning 6% is doing worse than a fixed deposit while making you carry full equity risk.
The catch is that ROE can be inflated by borrowing. Load a mediocre business with debt and the equity base shrinks relative to profit, so ROE looks impressive right up to the point where interest costs bite. One-off items do the same thing — a land sale, a tax writeback, an insurance claim. So read ROE across five years, not one. A steady 15-20% for five years is a far stronger signal than a single year at 35%. In our universe, 30.2% of companies with full-year fundamentals cleared ROE above 15% as of August 2026.
Why is ROCE often a better test than ROE?
ROCE asks a fairer question: what does the business earn on all the capital it uses, borrowed money included? Take operating profit before interest and tax and divide it by equity plus debt. Because the denominator includes the lenders' money, leverage cannot flatter the answer. That is why ROCE is the better first filter for capital-heavy businesses — manufacturing, chemicals, auto ancillaries, cement, capital goods. It separates companies that genuinely earn from their factories from companies that merely borrowed their way to a bigger profit line.
The rule of thumb in India is simple. Compare ROCE with what the company pays on its loans. If the business earns less on capital than its bankers charge, every rupee of expansion is quietly destroying value, no matter how exciting the order book sounds. Above 15% is a reasonable bar in a market where corporate borrowing is rarely cheap. As of August 2026, 30.6% of the 1,518 companies we track with full-year fundamentals cleared ROCE above 15%. That is roughly three in ten — a reminder that most listed companies are not high-return businesses, whatever the price chart is doing this month.
How much debt is too much for a listed Indian company?
Debt-to-equity is total borrowings divided by shareholders' equity. Below 1 means the owners have put in more than the lenders. Below 0.5 is comfortable. Above 2 in a cyclical business is where retail portfolios get destroyed, because a bad year hits profits while interest still has to be paid on the same date every quarter. As of August 2026, 84.5% of companies in our universe — 1,282 out of 1,518 — carried debt-to-equity below 1. So this screen on its own rejects very little.
Because it rejects so little, pair it with interest coverage: operating profit divided by interest cost. Below about three, the company is effectively working for its lenders. One important exception — banks and NBFCs are unfairly penalised by a flat debt-to-equity rule, because borrowing is their business model, not a weakness. A lender running at six times equity may be perfectly healthy. Apply the debt screen to manufacturing, services and consumer companies, and use a different set of numbers for financials, which we come to further down.
What PE ratio is reasonable on the NSE and BSE right now?
PE is the share price divided by earnings per share. It tells you how many years of today's profit you are paying up front. As of August 2026, the median PE across our universe is 24.0. So a stock at 24 is ordinary, not a bargain. And 65.1% of companies with fundamentals — 988 of them — trade at a PE between 0 and 40, which means moderately high valuations are the norm on the Indian market rather than the exception. Knowing the median stops you from calling something cheap just because it is cheaper than the loudest stock on your timeline.
Two warnings. A low PE is often a warning label rather than a bargain: cyclical companies look cheapest at the top of their cycle, because one year of peak profit is sitting in the denominator. And PE is meaningless for a loss-making company, and misleading when profit includes one-off gains. Use PE only after the quality tests are passed. Buying a weak business because it looks cheap is the single most expensive habit in Indian retail investing.
How do you check whether the reported profit is real cash?
Profit is an opinion; cash is a fact. Pull operating cash flow from the cash flow statement and compare it with net profit, adding up five years of each rather than comparing a single year. If cumulative operating cash flow is far below cumulative profit, the profit is sitting in receivables and inventory instead of the bank account. That gap is where most accounting accidents in Indian smallcaps begin, and it usually shows up in the numbers a year or two before it shows up in the share price. This one check will keep you out of more trouble than any valuation ratio.
Two supporting checks. Watch debtor days — money owed by customers as a share of sales. If it stretches year after year while sales grow, the company may be buying growth by selling on generous credit to people who may not pay. Watch inventory the same way. Also check whether promoter share pledging is rising and whether the auditor was changed abruptly. None of these are ratios in the textbook sense, but together they answer the question ratios alone cannot: is the reported number believable?
Which ratios should you use for banks and NBFCs instead?
For banks and NBFCs, put debt-to-equity aside and use a different panel. Return on assets tells you how well the lender uses its balance sheet. Net interest margin shows what it earns on the gap between borrowing cost and lending rate. Gross and net non-performing assets show how much of the loan book has gone bad, and the provision coverage ratio shows how much of that trouble has already been set aside against profits.
Add capital adequacy — the regulatory cushion the RBI insists on — and the cost-to-income ratio, which measures operating efficiency. For lenders, ROE still matters, but read it alongside asset quality: a lender can print a wonderful ROE for three years by lending loosely, then hand all of it back in one year of provisions. Insurance, IT services and real estate each change the panel again. There is no single ratio set that works for every sector, and pretending otherwise is exactly how a screener leads people astray.
How do you combine these ratios into one usable screen?
Stack them as a funnel, quality before price. Start with the whole market. Ask for ROE above 15%, ROCE above 15% and debt-to-equity below 1 at the same time. As of August 2026, only 22.0% of the 1,518 Indian companies with full-year fundamentals cleared all three together. Then add a single valuation check — PE under 40 — and you are left with 15.9%, or 241 companies. That is a starting shortlist, not a buy list. The screen has done its job when it has told you which 1,600 companies you no longer need to think about.
Here is a worked example using purely illustrative figures. Suppose a company reports ₹150 crore of operating profit, ₹90 crore of net profit, ₹500 crore of equity and ₹200 crore of debt. ROE is 18%, ROCE is roughly 21%, debt-to-equity is 0.4 — it clears the quality bar. At a market value of ₹2,700 crore the PE is 30, above the median, so you are paying up for that quality. Now the real work begins: is 18% repeatable for another five years, and did the cash flow statement back up that ₹90 crore?
What mistakes do retail investors make when using ratios?
The most common mistake is using one year of data. A single good year proves nothing. Ratios are only useful as a five-year trend, and the direction usually matters more than the level: ROCE sliding from 22% to 14% is a worse signal than a steady 16% held through a downturn. The second mistake is comparing across sectors. An FMCG company and a steel company have no business being ranked against each other on the same PE, because their capital needs and cycles are nothing alike.
The third is screening on price first. Sort the market by lowest PE and you will fill your portfolio with businesses the market has correctly given up on. The fourth is forgetting your own costs: frequent switching turns long-term gains into short-term ones taxed at a higher rate, and brokerage, STT and stamp duty quietly eat the rest, so a ratio-driven approach only pays if you are willing to hold. The fifth is skipping the annual report. Ratios point you at a company; the notes to accounts tell you whether to trust it.
Click Here – See BossInvestor's Data-Driven Stock Screens
Conclusion
Ratios do not pick stocks for you — they eliminate, which is most of the job. Run quality first with ROE, ROCE and debt, confirm the profit with cash flow, look at price only after that, and judge everything on five years rather than one. When barely a fifth of the listed market clears a basic quality bar, saying no quickly is the skill worth building. If you would rather see the shortlist already screened with the reasoning attached, that is what our research inside the BossInvestor app is for.
BossInvestor is a SEBI Registered Research Analyst (INH000024143). This article is for educational and informational purposes only. It explains a method and is not investment advice, nor a recommendation to buy, sell or hold any security. Market-wide figures are computed from our universe as of August 2026; past metrics do not guarantee future results. Always do your own research or consult a registered adviser before investing.
Frequently Asked Questions
Is a low PE always a good sign in Indian stocks?
No. A low PE often means the market has seen something you have not — falling margins, a lost customer, a governance problem. Cyclical companies look cheapest at the peak of their cycle, because one year of unusually high profit sits in the denominator. PE is also useless for a loss-making company. Treat a low PE as a question to investigate, never as an answer. Run the quality tests on ROE, ROCE and debt first, and only then look at the price you are being asked to pay.
What counts as a good ROE and ROCE for an Indian company?
Above 15% for both is the common working bar, and it is stricter than it sounds. As of August 2026, only 30.2% of the 1,518 companies in our universe with full-year fundamentals had ROE above 15%, and 30.6% had ROCE above 15%. What matters more than the exact number is consistency. Five years in the 15-20% band beats one spectacular year at 35%, which usually turns out to be a one-off gain, an asset sale or a cyclical peak that will not repeat.
Should I use debt-to-equity when looking at banks and NBFCs?
No. Borrowing is a lender's raw material, so a flat debt-to-equity rule unfairly penalises banks and NBFCs — a perfectly healthy lender can run at six or eight times equity. For financials, look instead at return on assets, net interest margin, gross and net non-performing assets, provision coverage and capital adequacy. Keep debt-to-equity and interest coverage for manufacturing, consumer and services companies, where borrowing funds the assets rather than forming the product being sold.
How many years of ratios should I look at before deciding?
Five years at minimum, and ideally a stretch that includes one bad year for the sector, because that is when the difference between a strong business and a lucky one shows up. A single year tells you almost nothing — it can be flattered by an asset sale, a tax writeback or a cyclical peak. Read the trend, not just the level. A company whose ROCE has slid from 22% to 14% is telling you something worse than one holding a steady 16%.
Can I pick stocks using financial ratios alone?
Not on their own. Ratios narrow the field; they cannot tell you whether the growth is durable, whether the promoter is trustworthy, or whether the industry is about to be disrupted. After screening, read at least two years of annual reports — particularly the notes to accounts, related-party transactions and promoter pledging disclosures. Think of ratios as a filter that lets you reject quickly, so your limited reading time goes to the handful of companies that actually deserve it.
Related Blogs
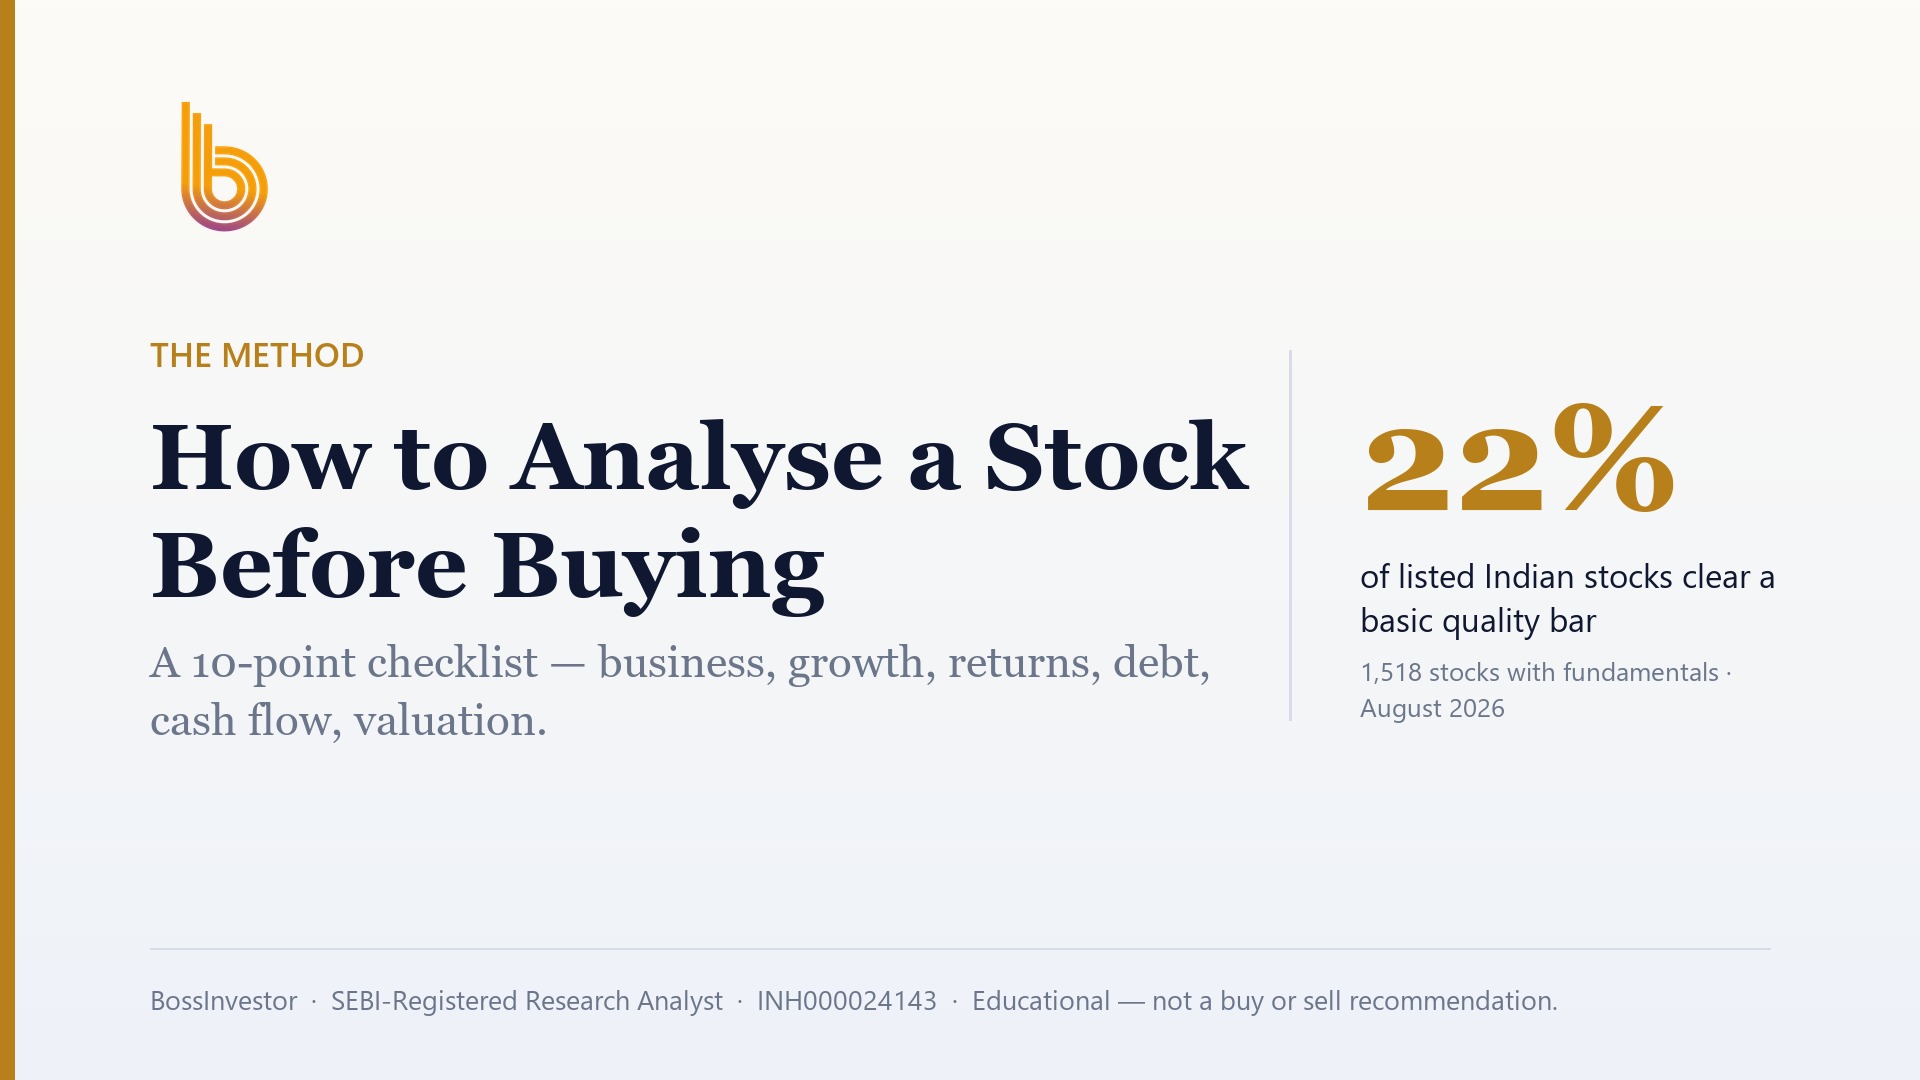
How to Analyse a Stock Before Buying: A 10-Point Checklist
Published: Mon Sep 07 2026Read more…

How to Calculate Your Financial Freedom Number and Achieve It
Published: Tue May 20 2025Read more…
 (1).jpg)
From Signal to Strategy: The Moving Averages
Published: Tue May 20 2025Read more…

Market Share: The Silent Signal of Competitive Power and Investment Opportunity
Published: Wed May 14 2025Read more…