How Do You Compare Two Stocks In The Same Sector?
Two companies sell the same thing, in the same country, to the same customers — and one makes shareholders rich while the other quietly destroys money. This page gives you the exact order in which to compare them: profitability first, debt second, growth third, cash fourth, price last. No tips, just the method.

BOSSINVESTOR
Mon Sep 07 2026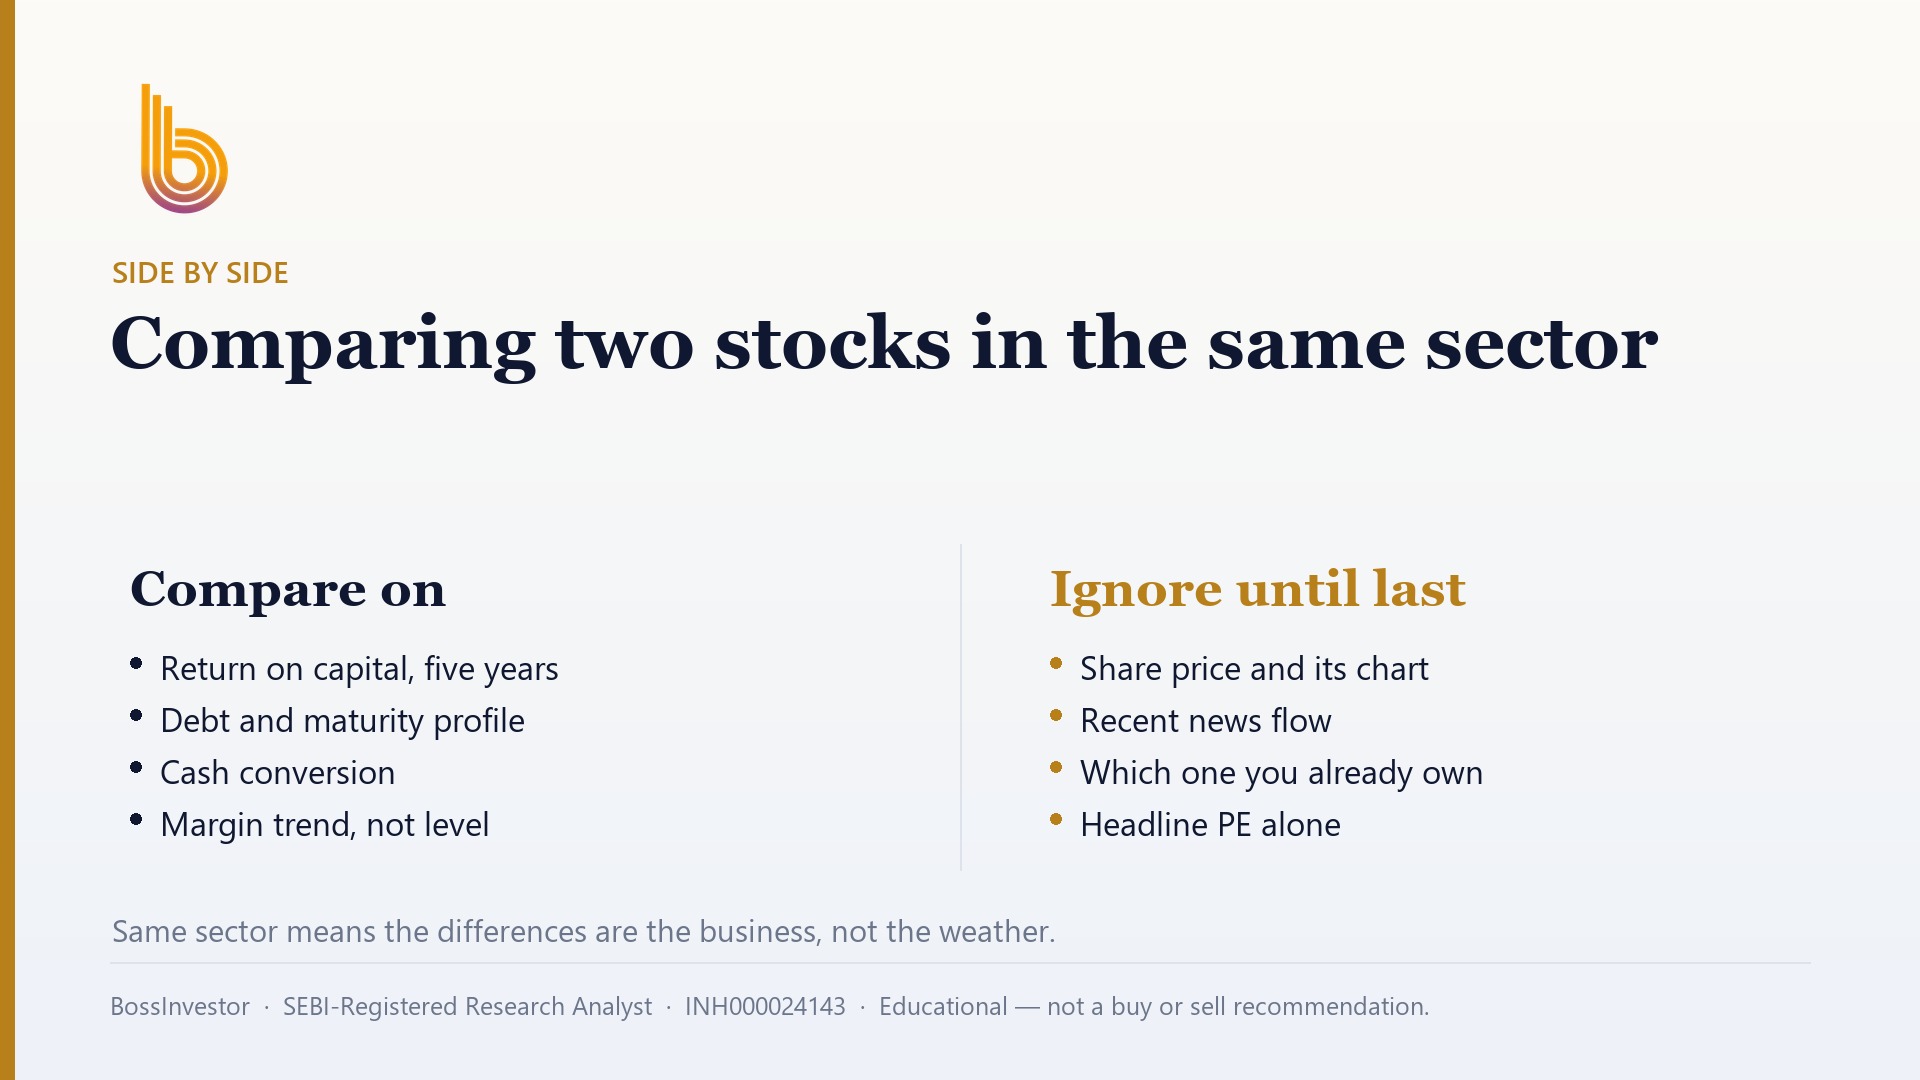
What is the right way to compare two companies from the same industry?
Compare two stocks in the same sector on five things, in this order: profitability (ROE and ROCE), debt-to-equity, five-year sales and profit growth, cash conversion, and only then valuation like PE. The cheaper stock is not automatically better — a lower PE usually means the market has already spotted something weaker in the business.
Key Takeaways
- Same sector means same rules — so differences in ROE and ROCE are differences in business quality, not accounting style.
- Compare profitability and debt before you ever look at the share price or PE.
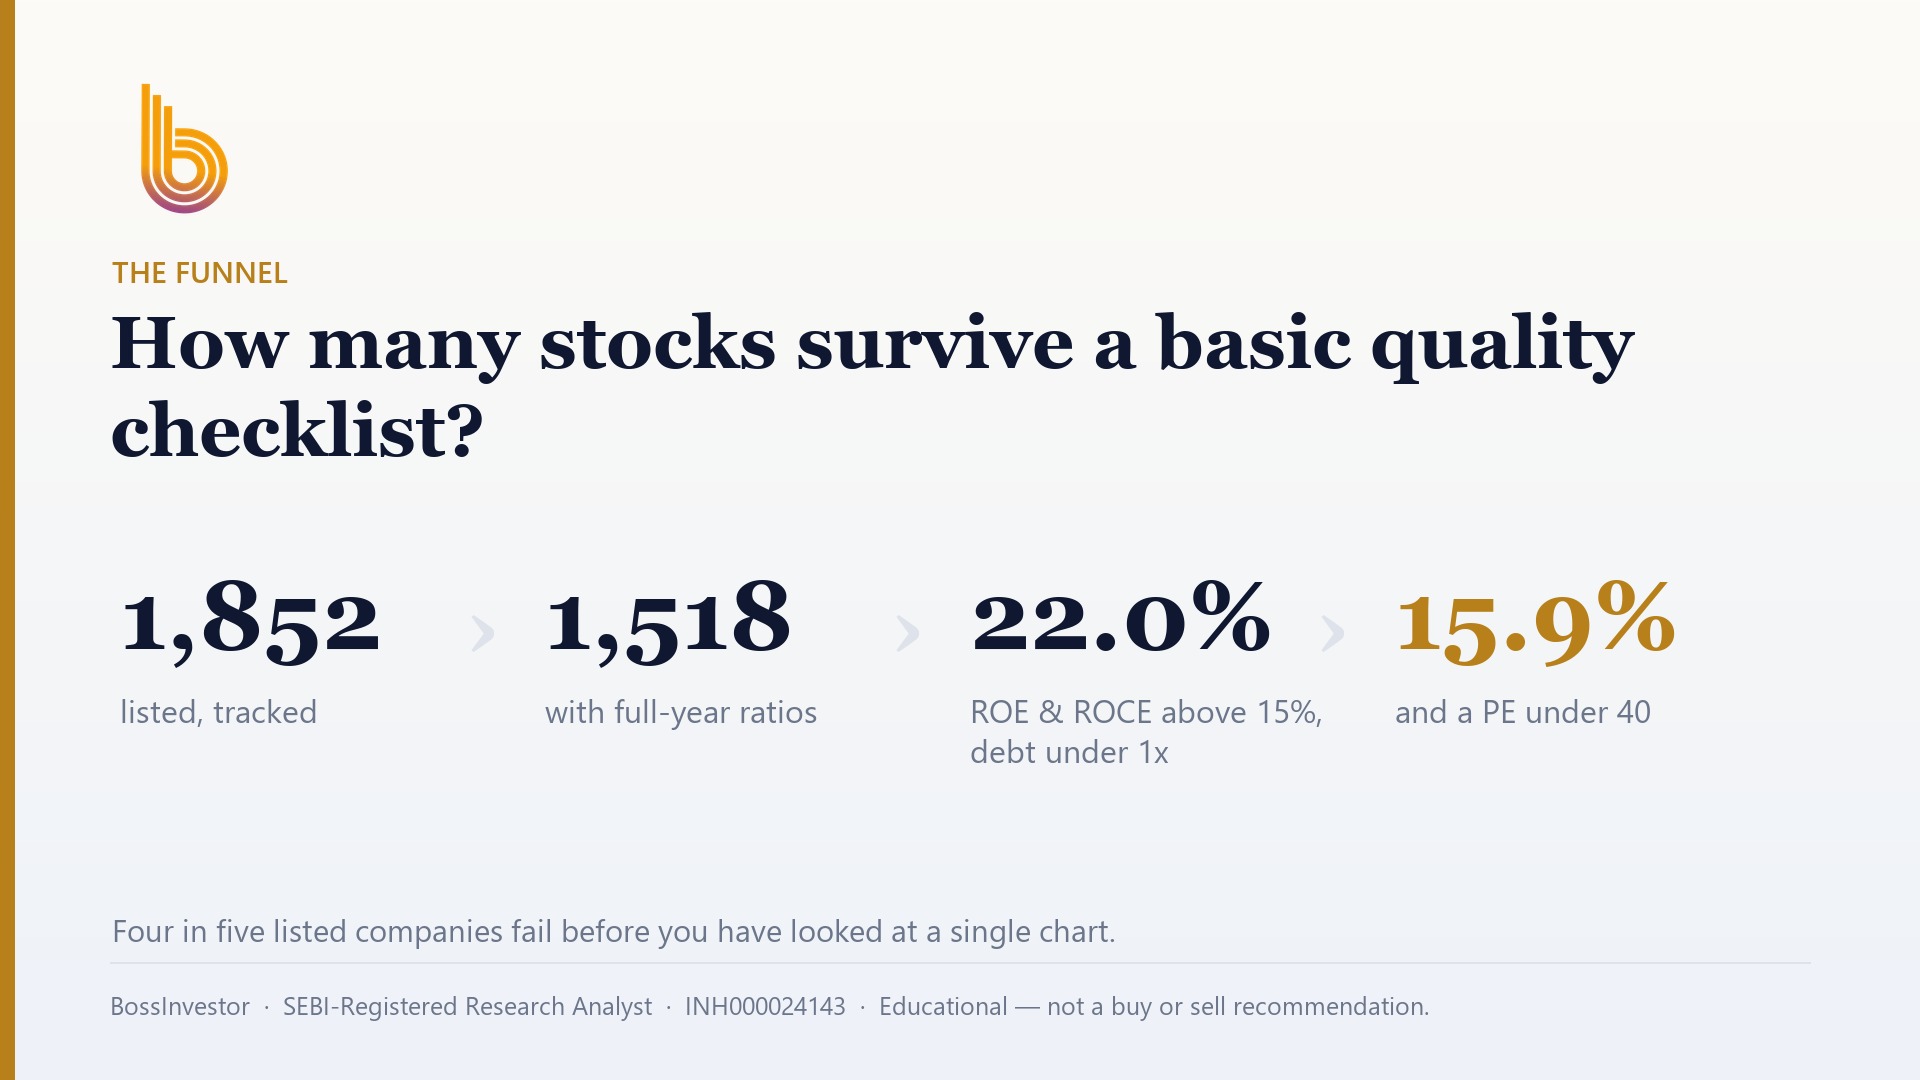
- Only 22.0% of the 1,518 Indian companies with full-year fundamentals in our universe clear ROE above 15%, ROCE above 15% and debt-to-equity below 1 together (as of August 2026).
- A lower PE is a question, not a discount — find out what the market is worried about.
- Never apply a flat debt rule to banks and NBFCs; borrowing is their raw material.
- Check five years, not one — a single strong year can be a commodity cycle, not skill.
What does "same sector" actually mean when comparing two stocks?
Same sector means the two companies face the same weather. Same raw material prices, same customers, same regulator, same monsoon, same interest rate cycle. Two cement companies both live or die on coal, limestone and freight. Two IT services firms both depend on US client budgets and the rupee-dollar rate. That shared weather is exactly what makes the comparison useful — when the conditions are identical, whatever is different in the numbers is coming from the business itself, not from luck.
But be strict about it. "Auto" is not a sector for comparison purposes. A two-wheeler maker and a truck maker sell to completely different buyers with different loan cycles. "Pharma" contains US-generics exporters and domestic-branded formulation companies, and they behave nothing alike. Get down to the sub-industry level before you compare. On the NSE, look at what the company actually earns revenue from in its annual report, not the index bucket it sits in.
Also check size. A ₹80,000 crore company and a ₹900 crore company in the same line of work are not really comparable — the smaller one may grow faster simply because it is starting from a small base, and the larger one may have pricing power the smaller one will never get. Compare like with like, or your conclusion is already wrong before you start.
Which numbers should I compare first when two stocks look similar?
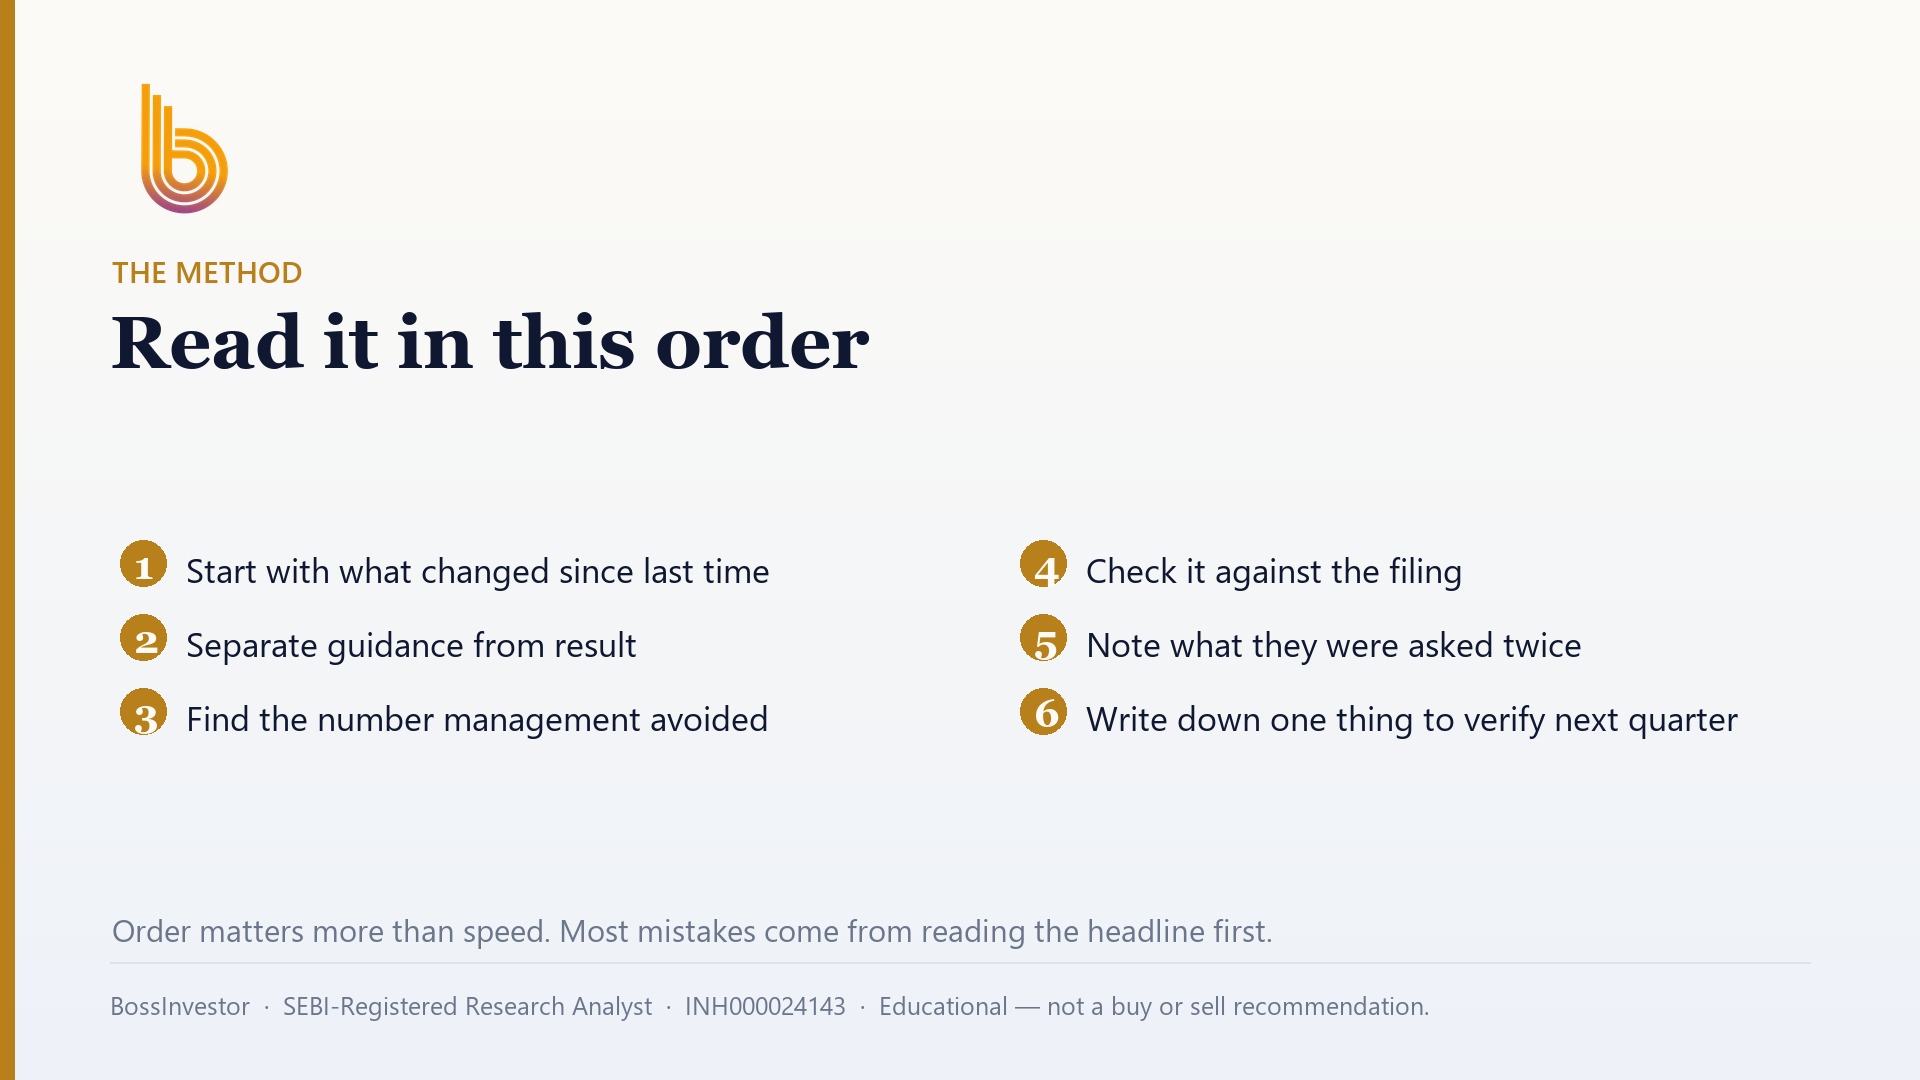
Follow a fixed order, because the order protects you from your own excitement. First, profitability: return on equity (ROE) and return on capital employed (ROCE). Second, debt: debt-to-equity. Third, growth: five years of sales and profit, not one. Fourth, cash: does reported profit actually turn into cash in the bank. Fifth, and only fifth, price: PE or price-to-book against the company's own history and against the other stock.
Most retail investors do this backwards. They open two charts, see one stock at ₹340 and the other at ₹2,100, and decide the ₹340 one is "cheaper". Share price by itself tells you nothing — it depends entirely on how many shares exist. A company can do a stock split tomorrow and halve its price without changing anything about the business.
Write the two names as two columns on a single sheet of paper and fill in the same rows for both. The discipline of the shared sheet is half the work. It stops you from praising one company's growth while quietly forgiving its debt, which is what happens when you research them on different days.
How do I tell which company is genuinely more profitable?
Use ROE and ROCE together. ROE tells you what the company earns on the shareholders' money. ROCE tells you what it earns on all the money it uses, including borrowed money. If ROE is high but ROCE is much lower, the company is likely borrowing heavily to flatter the ROE number. In the same sector, the business with higher ROCE is usually the one with a real edge — a brand, a distribution network, a cost advantage, a licence others cannot easily get.
How high is high enough? Our own screen gives you a benchmark. Of 1,518 listed Indian companies with full-year fundamentals in our universe as of August 2026, only 30.2% earn ROE above 15% and only 30.6% earn ROCE above 15%. So if one of your two stocks clears 15% on both and the other does not, you are not splitting hairs — you are comparing the top third of the market with everyone else.
One caution: check whether the profitability is steady or a one-off. A company that earned 8%, 9%, 7% and then suddenly 24% ROCE has probably sold land, won a legal case, or caught a price spike. Read the notes to the accounts for "other income" and "exceptional items". Steady 17% beats a spiky 24% almost every time.
Is the cheaper stock always the better one to buy?
No, and this is where most money is lost. When two companies in the same sector trade at very different PE ratios, the market is telling you something. The cheaper one usually has slower growth, weaker margins, more debt, a governance question mark, or a customer it cannot afford to lose. Your job is to find out which of those it is. If you can name the reason and you think it is temporary and fixable, you have found something. If you cannot name it, you have not found a bargain — you have found a company you do not understand yet.
Context helps. Median PE across our universe is 24.0 as of August 2026. That is a rough centre of gravity for the Indian market, not a rule. Sectors sit far away from it in both directions for legitimate reasons — a slow, capital-heavy business deserves a lower multiple, and a business that grows without needing new factories deserves a higher one. So compare each stock's PE to its own sector and its own five-year history, not to some universal number.
The useful combination is quality and price together, and it is rare. Only 15.9% of companies in our universe clear ROE above 15%, ROCE above 15%, debt-to-equity below 1 and PE under 40 at the same time (as of August 2026). Roughly one in six. If one of your two stocks is in that group and the other is not, the comparison has largely answered itself.
How should I compare debt between two companies in the same industry?
Debt-to-equity below 1 is the common starting line, and 84.5% of companies in our universe clear it as of August 2026 — so failing it is genuinely unusual and worth a hard look. But the ratio alone is thin. Also check interest coverage: how many times over does operating profit cover the interest bill? A company covering interest eight times can survive a bad year. One covering it 1.5 times is one weak quarter away from trouble.
Then look at the direction. Debt falling year after year while the business grows is a very different story from debt rising to fund growth that has not arrived yet. And check for debt hiding outside the number — guarantees given to subsidiaries, and promoter shares pledged with lenders. Pledged promoter holding is disclosed to the exchanges every quarter and takes two minutes to check on the NSE or BSE website.
Important exception: do not apply a flat debt-to-equity rule to banks and NBFCs. Borrowing money and lending it out at a higher rate is their entire business model, so a high ratio is normal and a low one may just mean the lender is not deploying capital. For those, compare net interest margin, gross and net NPAs, provision coverage and capital adequacy instead.
How do I compare growth without being fooled by one good year?
Pull five years of sales and net profit for both companies and look at the shape, not just the endpoints. Sector-wide booms lift everyone — during a strong steel or chemical cycle, the worst company in the sector also posts record profit. The question is what happened in the bad years. The business that stayed profitable when the cycle turned is the stronger one, and that only shows up if you look back far enough to include a downturn.
Compare sales growth and profit growth side by side. If profit is growing much faster than sales for years, margins are expanding — find out why, because margin expansion cannot run forever. If sales grow but profit does not, the company is buying revenue with discounts and has no pricing power. Between two companies in the same sector, the one whose profit grows roughly in line with or a bit ahead of sales, consistently, is usually the healthier one.
Finally, check that profit is real. Compare cash from operations with net profit over five years. If a company reports ₹100 crore of profit but keeps collecting only ₹60 crore in cash, the money is sitting in receivables or inventory. In the same sector with the same payment norms, the company that converts profit to cash better is running a tighter business.
What does a side-by-side comparison of two stocks look like in practice?
Here is an illustrative example with made-up figures — these are not real companies and not a recommendation. Say Company A and Company B are both mid-sized specialty chemicals makers. Company A: ROE 19%, ROCE 21%, debt-to-equity 0.3, five-year sales growth 14% a year, cash from operations broadly matching profit, PE 32. Company B: ROE 12%, ROCE 11%, debt-to-equity 1.4, five-year sales growth 16% a year, cash consistently below reported profit, PE 15.
The instinct is to pick B, because PE 15 versus PE 32 looks like a bargain. Run the order instead. B loses on profitability, loses badly on debt, and loses on cash conversion. It wins only on headline sales growth — and it is growing sales using borrowed money that is not coming back as cash. B is not cheap. It is priced for the risk it carries.
That does not automatically make A the answer either. At PE 32 against a market median of 24.0 as of August 2026, A is priced for continued execution. If its growth slows to 6%, the price can fall even though nothing about the business is broken. So the honest conclusion from this sheet is: A is the better business, and the open question is whether today's price leaves you anything. That question — what to actually do about it — is a separate piece of work from the comparison itself.
What do most retail investors get wrong when comparing two stocks?
Four mistakes come up again and again. One, comparing share prices instead of valuations. Two, comparing a single year's numbers, usually the most recent and most flattering one. Three, letting the story decide — an inspiring founder interview or a hot theme quietly overrides a weak balance sheet. Four, comparing two stocks you already own, which is not analysis, it is looking for permission.
There is a fifth, less obvious one: comparing across sectors by accident. Putting a lender's debt ratio next to a manufacturer's, or a software company's asset turnover next to a cement plant's, produces numbers that look decisive and mean nothing. If you find yourself concluding that every bank is dangerously leveraged, you have used the wrong yardstick, not found a hidden truth.
And remember the switching cost. Selling one stock to buy a slightly better one in the same sector triggers brokerage, STT and capital gains tax, and gains booked within a year are taxed more harshly than long-term ones. A small quality edge on paper can vanish entirely after those costs. Switching should require a clear gap, not a marginal one.
What should I do if both stocks pass every test?
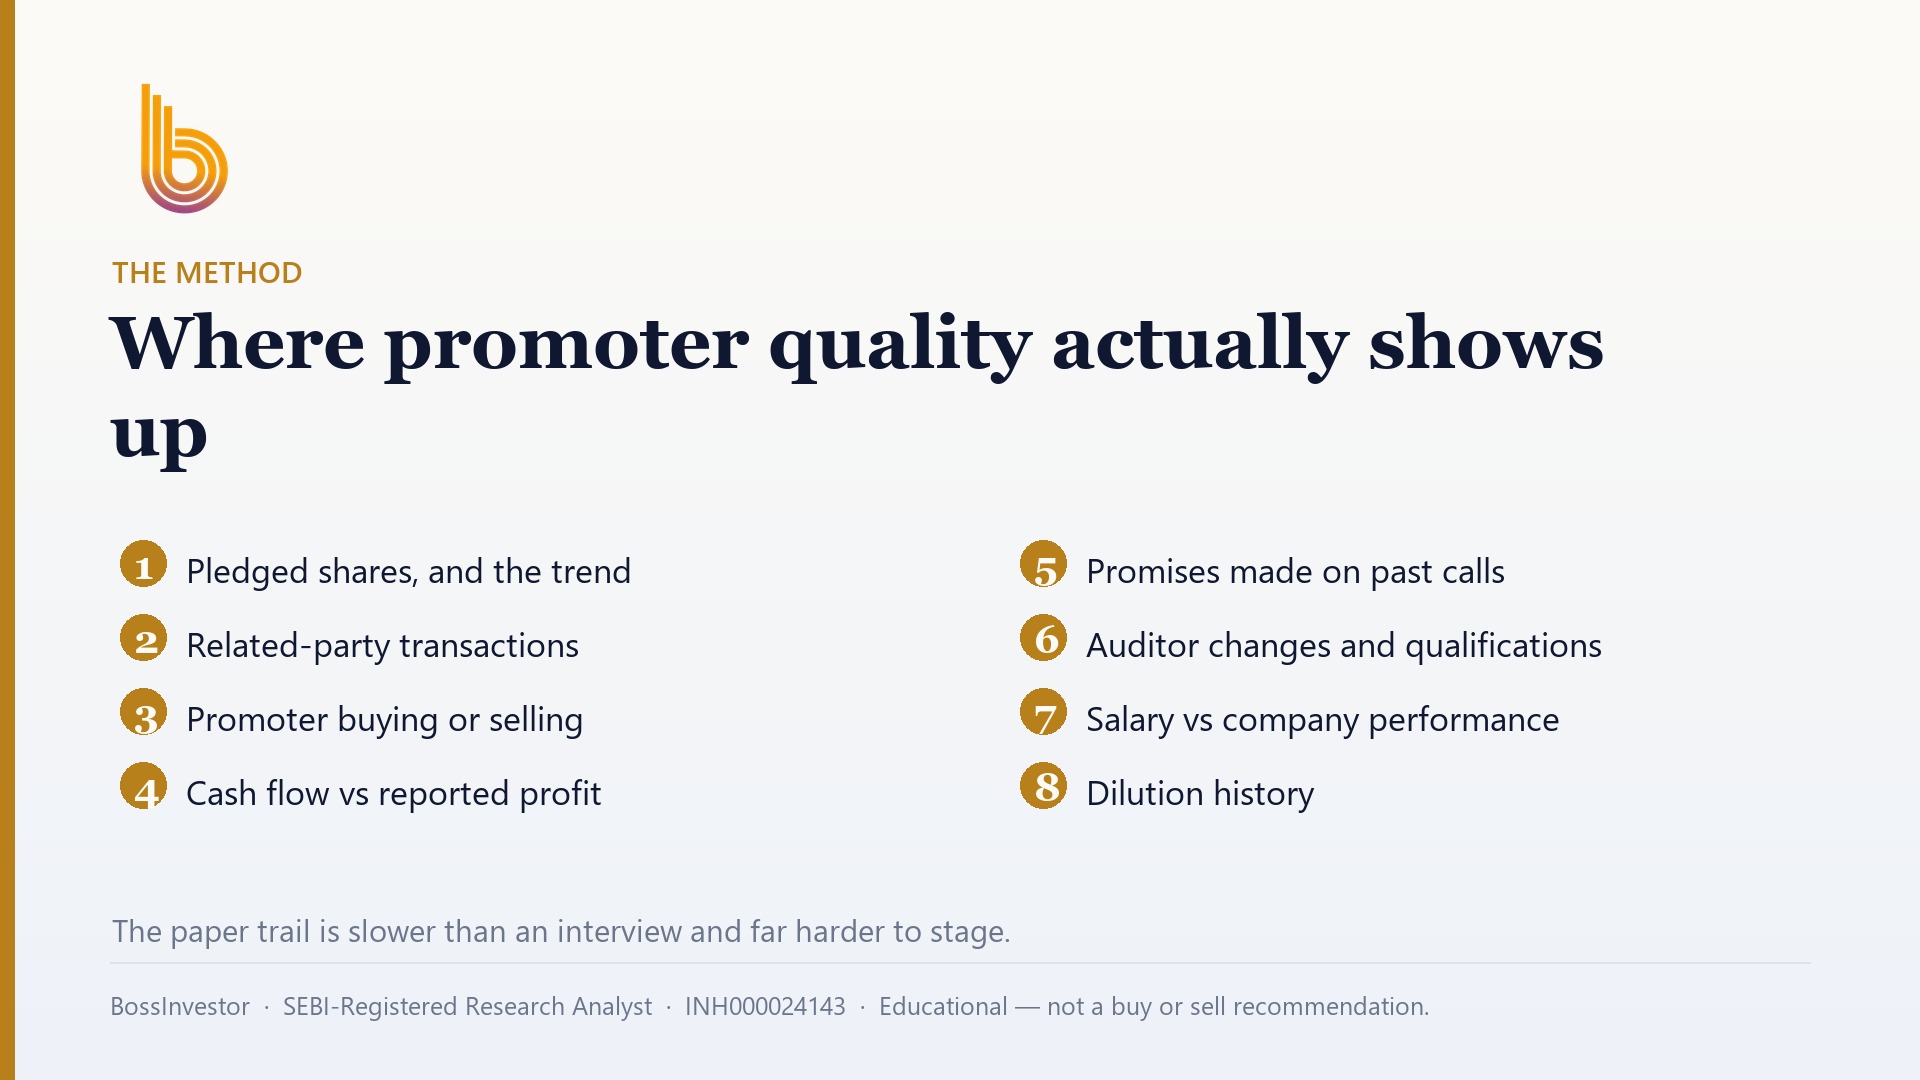
Sometimes both companies are genuinely good. Then move to the tiebreakers that do not show up in ratios. Read three years of the management discussion in both annual reports — does management name its problems plainly, or only its achievements? Check related-party transactions. Check whether promoter holding has been falling quietly. Check whether auditor comments have changed. Governance is the one factor that can take a good business to zero, and it is visible for free on the exchange filings.
Then ask what each company depends on. If one earns 40% of revenue from a single client or a single geography, its future has a single point of failure. Concentration is not automatically bad, but between two otherwise equal businesses, the more diversified revenue base is worth more than a percentage point of ROCE.
If they are still level after all that, the honest answer is that you do not have to choose. Two good businesses in the same sector can both sit in a portfolio, sized smaller each. Forcing a winner out of a genuine tie is how people talk themselves into false confidence.
Click Here – See BossInvestor's Data-Driven Stock Screens
Conclusion
Comparing two stocks in the same sector is not about finding the cheaper ticker. It is about running both through the same fixed order — profitability, debt, growth, cash, then price — and refusing to skip a step because you already like one of them. The numbers from our universe show why the discipline matters: as of August 2026, only 22.0% of the 1,518 companies with full-year fundamentals clear a basic quality bar of ROE above 15%, ROCE above 15% and debt-to-equity below 1 together. Most sector pairs have a clear winner on quality once you actually line them up. What you then do about the price is a separate decision — and if you want that side of it worked out for a specific pair, that is the research we do inside the app, after KYC.
BossInvestor is a SEBI Registered Research Analyst (INH000024143). This article is for educational and informational purposes only. It explains a method and is not investment advice, nor a recommendation to buy, sell or hold any security. Market-wide figures are computed from our universe as of August 2026; past metrics do not guarantee future results. Always do your own research or consult a registered adviser before investing.
Frequently Asked Questions
Can I compare two stocks using only the PE ratio?
No. PE tells you what the market is willing to pay for a rupee of profit, but not whether that profit is durable or how much debt sits behind it. Two companies in the same sector can have very different PEs for perfectly good reasons — different margins, growth, or governance history. Use PE last, after profitability, debt, growth and cash conversion. Median PE across our universe is 24.0 as of August 2026, which is a reference point, not a rule.
Which is more useful for comparison, ROE or ROCE?
Use both, but lean on ROCE when debt levels differ. ROE measures return on shareholders' money alone, so a heavily borrowed company can post a flattering ROE. ROCE covers all capital employed, including debt, so it is harder to dress up. In our universe as of August 2026, 30.2% of companies with full-year fundamentals earn ROE above 15% and 30.6% earn ROCE above 15%. When one figure is high and the other is not, the gap itself is telling you about leverage.
How do I compare two banks or two NBFCs in the same sector?
Skip the flat debt-to-equity rule entirely — lenders borrow as their business model, so a high ratio is normal there and penalising it gives a false signal. Compare net interest margin, gross and net non-performing assets, provision coverage ratio, capital adequacy, cost-to-income ratio, and loan book growth alongside deposit or borrowing growth. Also check how concentrated the loan book is by segment and geography. A lender growing its book far faster than peers deserves a hard look at underwriting quality.
How many years of data should I look at when comparing two stocks?
At least five years, and ideally a period that includes one bad year for the sector. One year tells you about the cycle, not the company. During a sector boom, weak companies post record numbers too; the difference shows up when demand falls. Look at sales, net profit, operating margin, debt and cash from operations across all five years for both companies. Consistency matters more than any single peak figure, and it is available free in the annual reports filed with NSE and BSE.
Should I sell one stock to buy the better one in the same sector?
Only if the quality gap is large, not marginal. Switching costs you brokerage, STT and capital gains tax, and gains booked inside a year are taxed at a higher rate than long-term gains. Those costs can wipe out a small edge on paper. Also consider that holding two good businesses in the same sector, each sized smaller, is a legitimate choice. Forcing a switch on a narrow difference usually reflects impatience rather than a genuine improvement in the portfolio.
Related Blogs
How to check promoter and management quality
Published: Mon Sep 07 2026Read more…
What is a good operating and net profit margin?
Published: Mon Sep 07 2026Read more…
Which financial ratios matter most for stock picking?
Published: Mon Sep 07 2026Read more…
How do I screen stocks using a stock screener?
Published: Mon Sep 07 2026Read more…